Figures & data
Figure 1 Scanning electron microscopy of the pristine buckypaper (BP) surface (A) and of the PAMAM-coated (PAM-BP) surface (B). The lower conductivity of the sample confirmed the effective coating with the PAMAM dendrimer. Scale bar: 1 µm. Energy-dispersive X-ray analysis of the pristine BP (C) and PAM-BP (D).
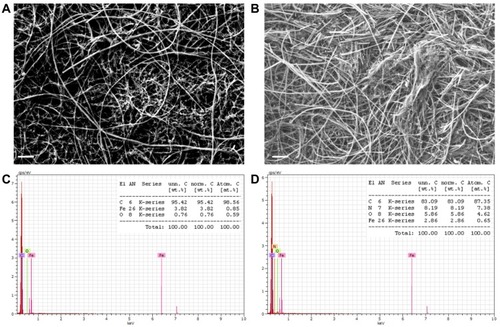
Figure 2 Height (left) and phase (right) channels by AFM measurements of the pristine buckypaper (A, B) and of the PAMAM-coated one (C, D). Arrows in panel D indicate the small bubble-like structures of the polymer coating the BP surface (D). In all panels, scale bar is 200 nm.
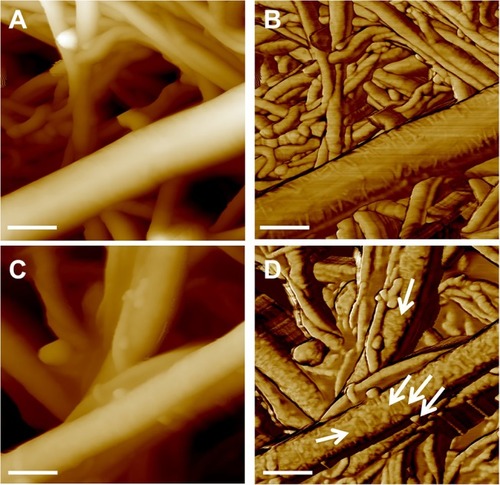
Figure 3 Raman spectra collected on BP (black curve) and PAM-BP (red curve) (A-D). Magnification of the high wavenumber spectral region (1; B); magnification of the central spectral region (2; C); and magnification of the low shift region (3; D).
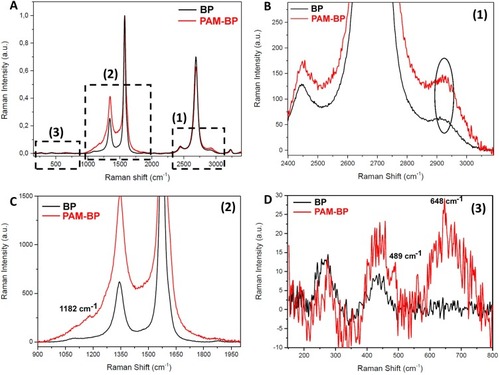
Figure 4 (A) 3D-printed multi-chamber device in its open and assembled configuration. (B) Procedure to obtain PAM-BP and assembling of the 3D-printed device.
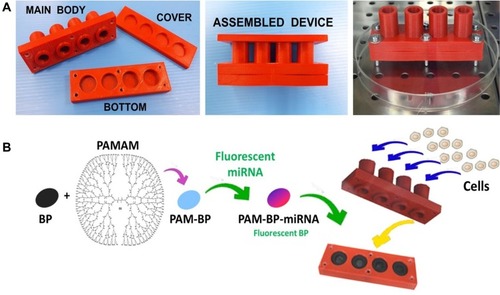
Figure 5 BCA protein assay to monitor cell growth on buckypapers (BP and PAM-BP). HEK-293T and Saos-2 cells have been cultured for up to 7 days and characterized at 1, 3, and 7 days after seeding. *P<0.05 and **P<0.005.
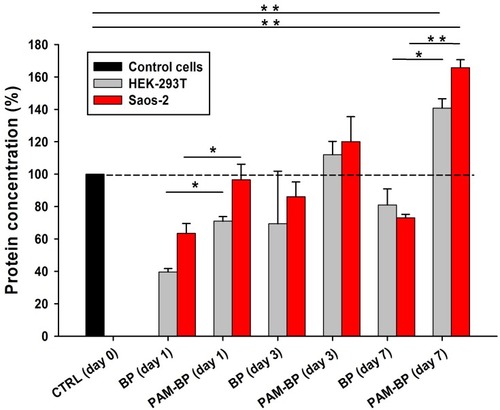
Figure 6 Scanning electron microscopy of HEK-293T (A), Saos-2 and osteoclast cells (B) grown on buckypapers at different time points (3 and 7 days). Scale bars are 10 µm.
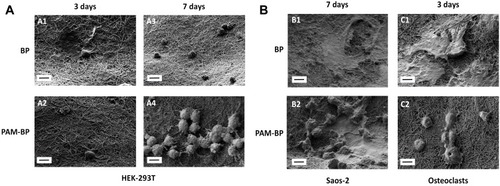
Figure 7 Preparation procedure for BP coating with PAMAM dendrimer and complexation with a fluorescent miRNA (A). Confocal microscopy of HEK-293T transfected for 1 day (B), 3 days (C) and 7 days (D) with PAM-BP functionalized with FAM-Pre-mir-503 mimic (400× magnification). The green lines (indicated by dashed white arrows) indicate different focal planes, while the intense green spots (indicated by white arrows) represent the transfected cells.
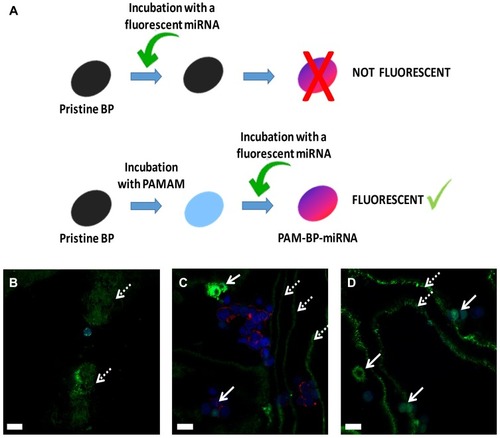
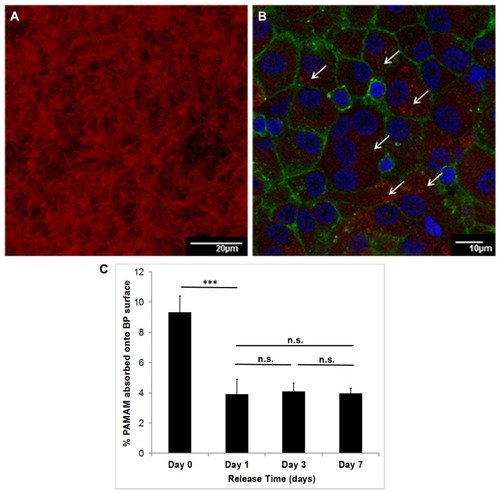
Figure 8 Confocal microscopy of the buckypaper incubated with PAMAM dendrimer labeled with rhodamine B isothiocyanate (10% w/w). The red filaments confirm the attachment of the polymer to the surface (A) (200× magnification). The osteoclasts membrane was stained with phalloidin-FITC and the multinucleated nuclei with Hoechst, which allows distinguishing the osteoclasts from their precursors (B). The red spots (indicated by white arrows) confirm the presence of PAMAM within the cells that is released progressively. Quantification of PAMAM absorbed onto BP surface (expressed as percentage in weight) (***= p-value<0.001; n.s= not significant) (C).