
Figures & data
Figure 1 Synthesis of ligand 5-fluorouracil-1-yl acetic acid (L1).
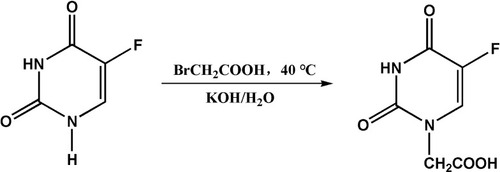
Table 1 Data Collection and Refinement Parameters for A3
Figure 2 Molecular diagram of [(PPh3)3Ag(L1)].[(PPh3)2Ag(L1)] (A3).
![Figure 2 Molecular diagram of [(PPh3)3Ag(L1)].[(PPh3)2Ag(L1)] (A3).](/cms/asset/950392ba-b10e-4537-bb93-b0d3b7fecdc9/dijn_a_12194370_f0002_c.jpg)
Figure 3 Electronic absorption spectra of the A3 (10 μM) in the absence and presence of amounts of CT-DNA (0, 0.005, 0.01, 0.015, 0.020, 0.025, 0.030, 0.035, 0.040, 0.045 mg mL−1) in KH2PO4/NaOH buffer ((A) pH = 6.2, (B) pH = 7.2, (C) pH = 8.2). Inset: Plot of A0/A-A0 vs.1/[DNA] for the titration of the A3 with CT-DNA. The binding constants (Kb) of A3 are 36.03 mg mL−1 (A), 50.40 mg mL−1 (B) and 41.1 mg mL−1 (C), respectively.
![Figure 3 Electronic absorption spectra of the A3 (10 μM) in the absence and presence of amounts of CT-DNA (0, 0.005, 0.01, 0.015, 0.020, 0.025, 0.030, 0.035, 0.040, 0.045 mg mL−1) in KH2PO4/NaOH buffer ((A) pH = 6.2, (B) pH = 7.2, (C) pH = 8.2). Inset: Plot of A0/A-A0 vs.1/[DNA] for the titration of the A3 with CT-DNA. The binding constants (Kb) of A3 are 36.03 mg mL−1 (A), 50.40 mg mL−1 (B) and 41.1 mg mL−1 (C), respectively.](/cms/asset/d4ef365b-1792-4a8d-b574-ce088199a719/dijn_a_12194370_f0003_c.jpg)
Figure 4 Emission spectra of EtBr (0.05 mM) connected to CT-DNA (0.12 mg mL−1) in the absence and presence of A3 (0.00, 0.02, 0.04, 0.06, 0.08, 0.10 mM) in KH2PO4/NaOH buffer (pH = 7.2). Inset: Stern–Volmer quenching curve. The KSV value is 2.789 × 10³ M−1.
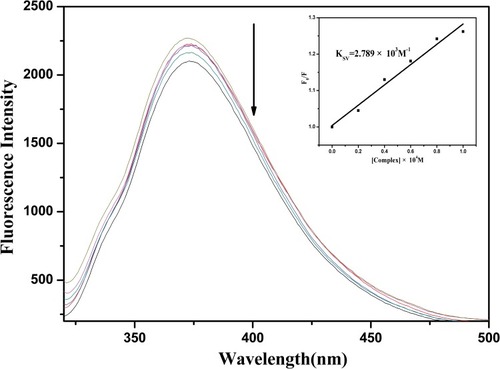
Figure 5 Cyclic voltammograms of Fe(CN)6 3-/4- in pH 7.2 KH2PO4/NaOH buffer solution at a bare Au electrode (a), CT-DNA/Au (b). The scan rate is 0.1 V s −1 and the concentrations of Fe(CN)63-/4- and KCl are 5 mM.
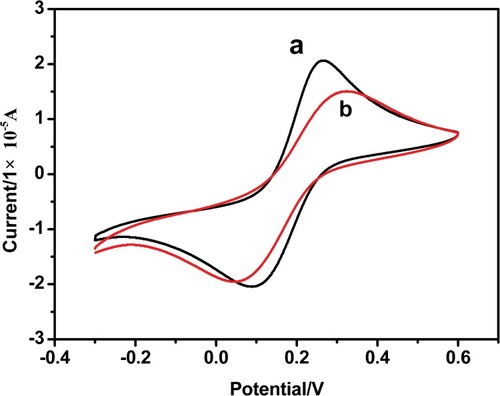
Figure 6 The relationship between anodic peak current and the scanning rate (0.01–-0.13 V s −1) for CT-DNA/Au.
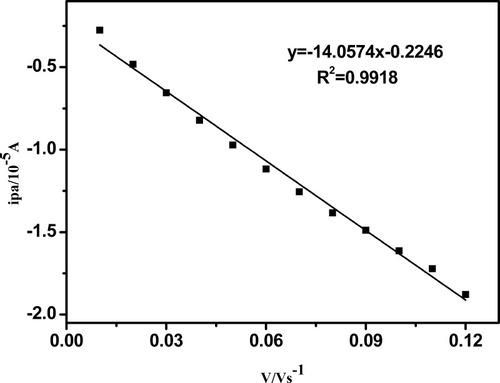
Figure 7 Cyclic voltammograms of Fe(CN)63-/4- in KH2PO4/NaOH buffer solution (pH 7.2) containing different concentrations of drugs. The scan rate is 0.1 V s −1 and the concentrations of Fe(CN)6 3-/4- and KCl are 5 mM.
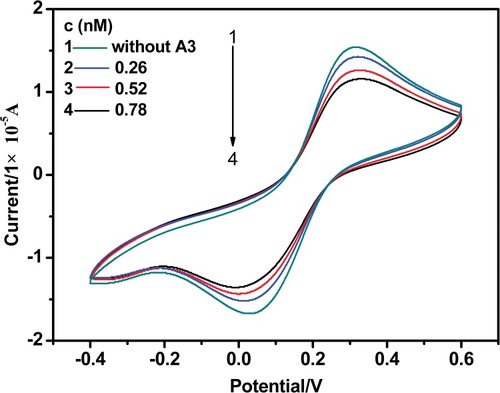
Figure 8 Adsorption isotherm of drug A3 on CT-DNA/Au. The solid line corresponds to the Langmuir model. Inset: The relationship between 1/[DRUG] and 1/ΔIP.
![Figure 8 Adsorption isotherm of drug A3 on CT-DNA/Au. The solid line corresponds to the Langmuir model. Inset: The relationship between 1/[DRUG] and 1/ΔIP.](/cms/asset/c009b759-b29d-4839-9293-7efc4af5e5fb/dijn_a_12194370_f0008_c.jpg)
Figure 9 Cell viability of A3+NIR, A3 and 5-Fu in HCT 116 cell line. Significant differences are indicated as ***P<0.001, **P<0.01, *P<0.05, n=3.
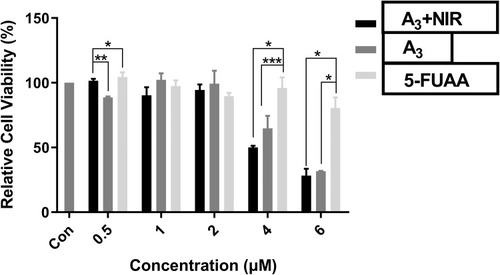
Figure 10 Cell viability of A3+NIR, A3 and 5-Fu in MDA-`MB-231 cell line. Significant differences are illustrated as **P<0.01, *P<0.05, n=3.
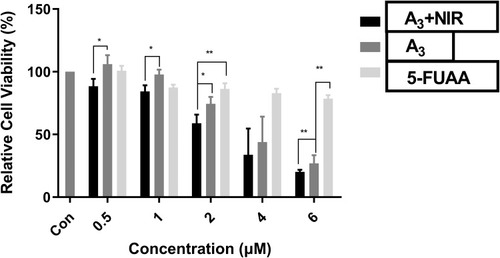
Table 2 IC50s of A3+NIR, A3 and 5-Fu (µm). IC50s Were Calculated Based on CCK-8 Results by IBM SPSS Statistics Software