
Figures & data
Table 1 Compositions Of Insulin (INS)-Loaded Solid Lipid Nanoparticles (SLNs)
Table 2 Particle Characterization Of Insulin (INS)-Loaded Solid Lipid Nanoparticles (SLNs)
Figure 1 Comparative DSC spectra of insulin (INS)-loaded solid lipid nanoparticles (SLNs).
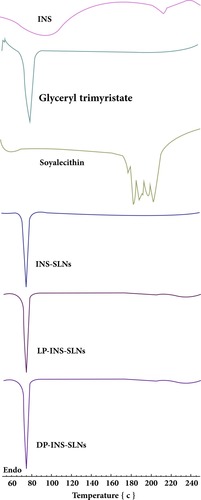
Figure 2 Comparative FTIR spectra of insulin (INS)-loaded solid lipid nanoparticles (SLNs).
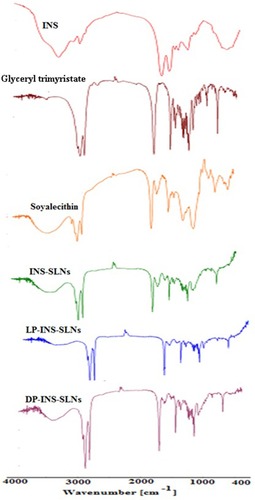
Figure 3 Release profile of INS from different SLNs in simulated gastric fluid (pH 1.2). Each data point represents the mean±SEM (n=3).
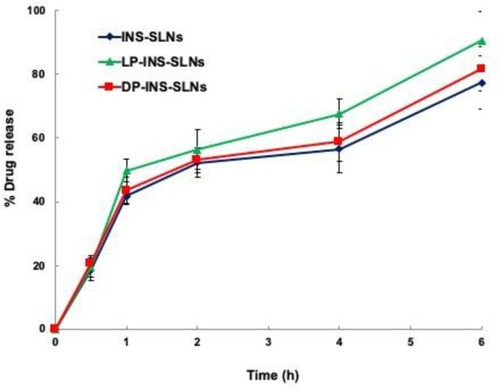
Figure 4 Release profile of INS from different SLNs in simulated intestinal fluid (pH 7.4). Each data point represents the mean±SEM (n=3).
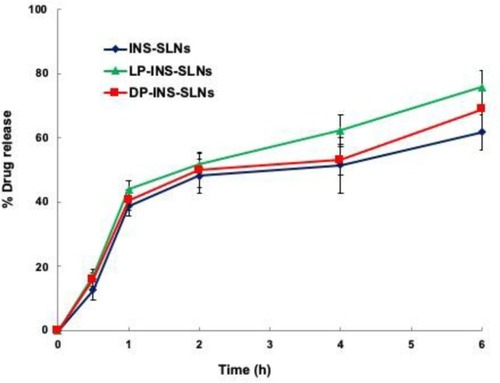
Table 3 Elimination Constant And Half-Life Of Insulin (INS) Solution And INS-Loaded Solid Lipid Nanoparticles (INS-SLNs) In Rat Intestinal Fluid
Figure 5 Degradation profile of INS solution (10 IU/mL) and INS-SLNs over time in rat intestinal fluid. Each data point represents the mean±SEM (n=3).
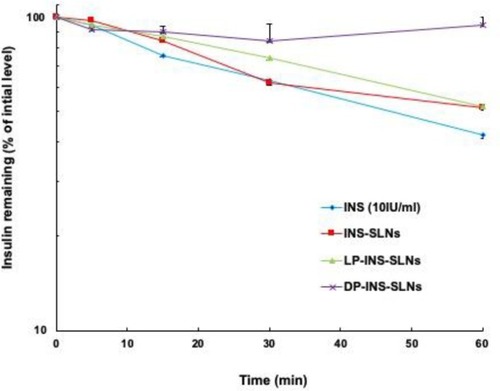
Figure 6 Blood glucose (A) and serum insulin (B) concentration vs time profiles following oral administration of INS solution (10 U/kg) and INS-SLNs. Each data point represents the mean±SEM (n=5).
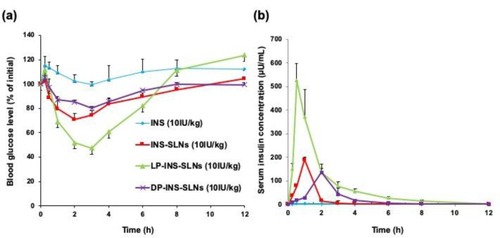
Table 4 Pharmacokinetic And Pharmacodynamic Parameters In Rats Following Oral Administration Of Insulin (INS) Solution And INS-Loaded Solid Lipid Nanoparticles (SLNs)