Figures & data
Figure 1 Synthesis route of the PTXL-ss-PMAGP-GEM conjugates (via steps A, B, C, and D).
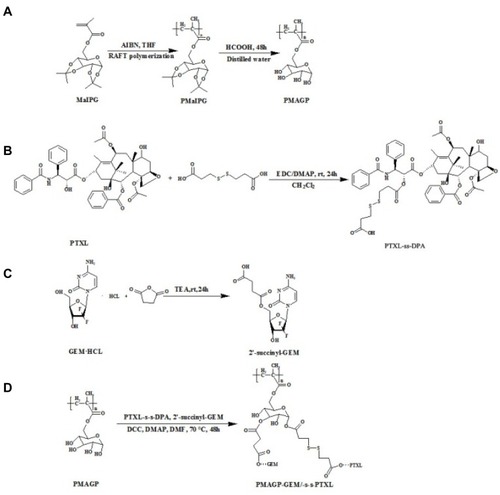
Figure 2 The 1H-NMR spectra of PTXL-ss-DPA (A), PMAGP (B), and PTXL-ss-PMAGP-GEM in DMSO-d6 (C). (D) Differential scanning calorimetric (DSC) thermographs of (a) PTXL, (b) GEM, (c) physical mixture of PTXL and GEM, (d) and PTXL-ss-PMAGP-GEM (exo up).
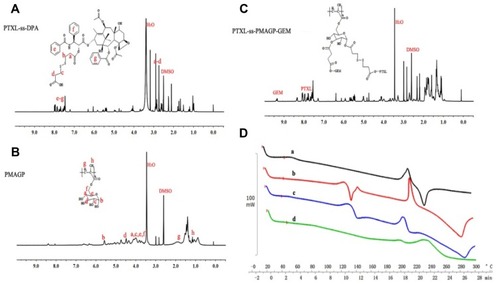
Figure 3 Characteristics of the PTXL-ss-PMAGP-GEM/NAG NLC nanoparticles. (A) Size distribution measured by DLS; (B) morphology by TEM; (C) the tumor micro-environmental triggered release profiles of PTXL, showing faster release rate in the presence of GSH (10 mM) particularly when pH is low (endosomal pH 6) than that in the extracellular environment (pH 7.4, and low GSH); and (D) the delayed release of GEM in the medium of pH 6 containing GSH 10 mM compared to PTXL.
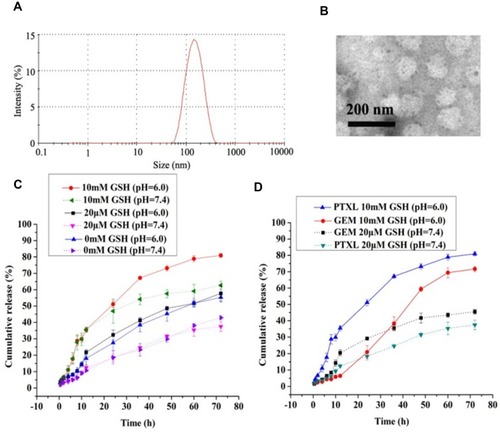
Table 1 Characteristics of Different NLC Formulations. Data are Means ± SD (n = 3)
Table 2 Cytotoxicity Expressed as IC50 and Combination Index (CI50) of Different Formulations in A549 and LTEP-a-2 NSCLC Cell Lines Following 72-h Exposure
Figure 4 The biocompatibility study of blank PMAGP/NAG NLCs against LTEP-a-2 cells, A549 cells and L929 cells for 72 h (A). Cytotoxicity against (B) A549 cells and (C) LTEP-a-2 cells for 72 h: (a) free GEM + free PTXL, (b) PTXL-ss-PMAGP-GEM NLCs, (c) PTXL-PMAGP-GEM/NAG NLCs, and (d) PTXL-ss-PMAGP-GEM/NAG NLCs. Data are mean ± SD (n = 6). ***P < 0.001 compared PTXL-ss-PMAGP-GEM/NAG NLCs with free drugs.
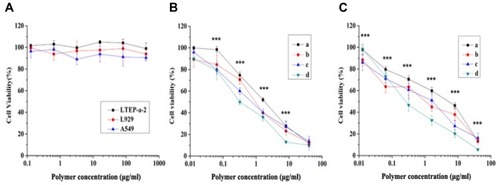
Figure 5 (A) Flow-cytometry analysis of FITC-PTXL-ss-PMAGP-GEM/NAG NLCs and FITC-PTXL-ss-PMAGP-GEM NLCs in A549 cells and LTEP-a-2 cells. Mean fluorescence intensity of A549 cells (B) and LTEP-a-2 cells (C) incubated with different formulations for 0.5, 2 and 4 h. (D) The mean fluorescence intensity in NSCLC cells A549 and LTEP-a-2 compared with normal cell fibroblasts L929 following treatment with FITC-PTXL-ss-PMAGP-GEM/NAG NLCs (concentration 10 µmoL/L). Data are mean ± SD (n = 3).
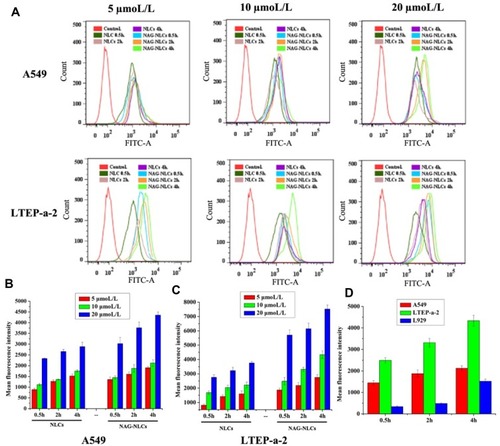
Figure 6 CLSM images of A549 cells incubated with FITC-PTXL-ss-PMAGP-GEM NLCs without NAG (A) in comparison with FITC-PTXL-ss-PMAGP-GEM/NAG NLCs (B) (equivalent to total drug concentrations 10 and 20 μmol/L) for 1, 2, 4 h, respectively. The scale bars correspond to 25 μm in all the images.
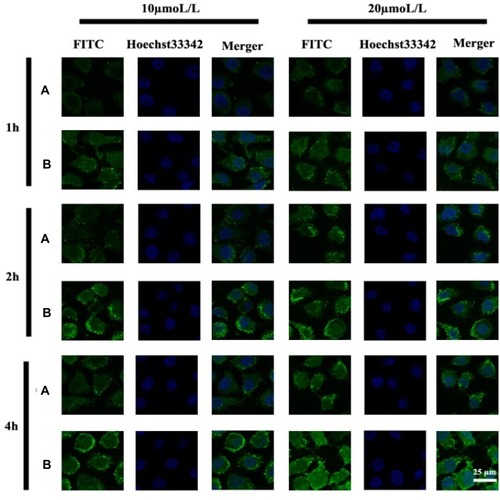
Figure 7 (A) Representative in vivo images of A549 tumor-bearing nude mice and (B) excised tumors and other organs at 8 h following i.v. injection of free DiR, DiR-labeled NCLs with or without NAG (ie, PTXL-ss-PMAGP-GEM/NAG NLCs and PTXL-ss-PMAGP-GEM NLCs).
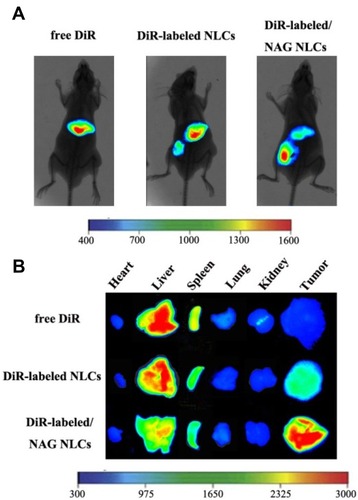
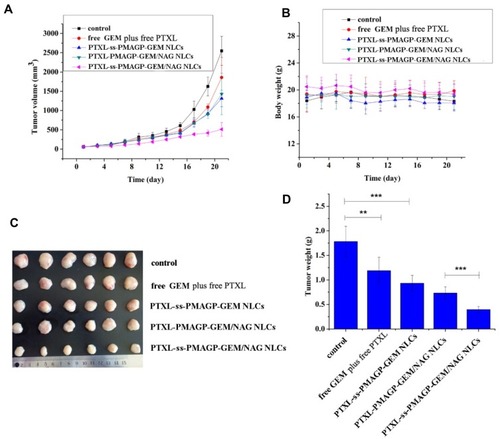
Figure 8 Anti-tumor efficacy in A549 xenograft models: (A) Tumor growth, (B) body weight profiles; (C) photographs of tumor tissues; and (D) tumor weight. The mice were treated with various formulations by i.v. injection at a dose of 4.74 mg/kg GEM and 5.12 mg/kg PTXL. **P < 0.01; ***P < 0.001.