
Figures & data
Table 1 Characteristics Of Eleven Groups For Cytotoxicity Assessment By MCF-7 Breast Cancer Cells
Scheme 1 Illustration of the synthesis procedure of PS-IONs and drug loading mechanism.
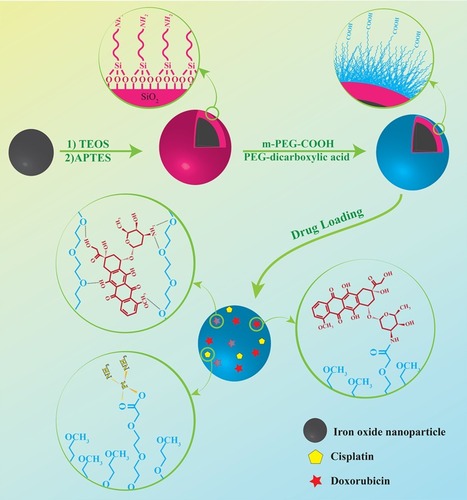
Figure 1 (a, b) TEM images of PS-IONs (scale bars are 150 nm and 40 nm, respectively). (c) XRD patterns [the yellow, green, pink, blue, violet, light brown and orange squares relate to (220), (311), (400), (422), (511), (440) and (530) planes of the spinel structure of magnetite, respectively], (d) hysteresis loops, (e) FT-IR spectra, and (f) DLS particles size distribution profiles of IONs (black line) and PS-IONs (red line).
![Figure 1 (a, b) TEM images of PS-IONs (scale bars are 150 nm and 40 nm, respectively). (c) XRD patterns [the yellow, green, pink, blue, violet, light brown and orange squares relate to (220), (311), (400), (422), (511), (440) and (530) planes of the spinel structure of magnetite, respectively], (d) hysteresis loops, (e) FT-IR spectra, and (f) DLS particles size distribution profiles of IONs (black line) and PS-IONs (red line).](/cms/asset/5a95be9f-f019-46cb-bfaa-f1e3b1dca855/dijn_a_12191199_f0002_c.jpg)
Figure 2 Viability of L929 normal fibroblast cells after 24, 48, and 72 hrs of incubation with different concentrations of PS-IONs (ranging from 10 to 500 µg/mL). There was no significant difference between the control and other groups.
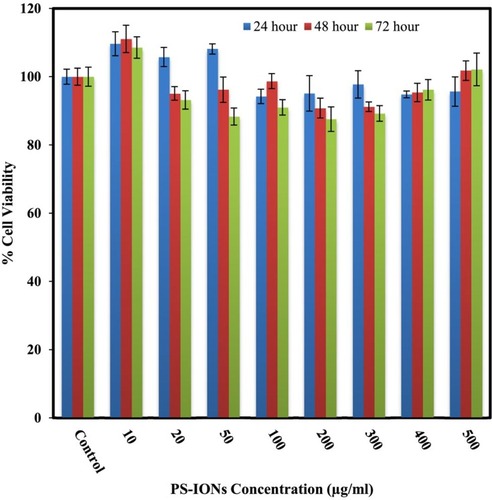
Figure 3 (a) Light microscopy images of the cells (the total magnification was 400 times) exposed to 100 (left) and 200 µg/mL (right) of PS-IONs for 24 hrs. The brown dots show the uptaken nanoparticles. (b) Concentration dependent cellular uptake percentage. The inset shows the amount of PS-IONs uptake (µg/mL) versus initial PS-IONs concentration (µg/mL) in the culture media.
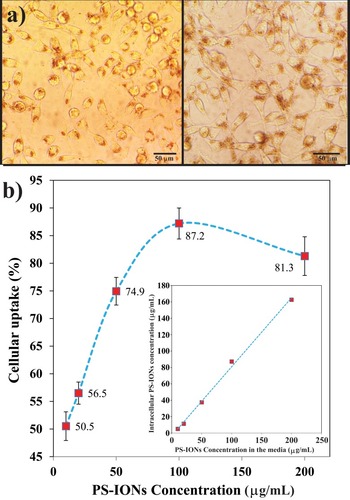
Table 2 Blood Coagulation Times After Dilution With The Same Volumes Of PBS And PS-IONs Suspension (final Concentration Of 200 μg/mL)
Figure 4 Light microscopy images (the total magnification was 400 times) of blood smear prepared samples from EDTA-anticoagulated blood without dilution (control) and after addition of PS-IONs (final concentration 200 μg/mL) and PBS after 4 h. The RBCs showed neither deformation nor aggregation when compared to the controls.
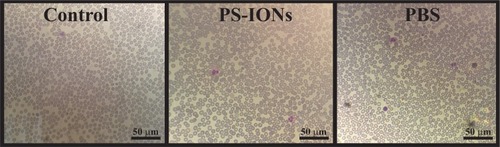
Figure 5 Loading capacity of (a) DOX and (b) CDDP on PS-IONs as a function of their initial concentation in the solutions containing 15 ppm of CDDP and DOX, respectively. In vitro release profiles of (c) DOX and (d) CDDP from PS-IONs at different temperature and pH conditions. Asterisks (*) indicate significant difference (P < 0.05).
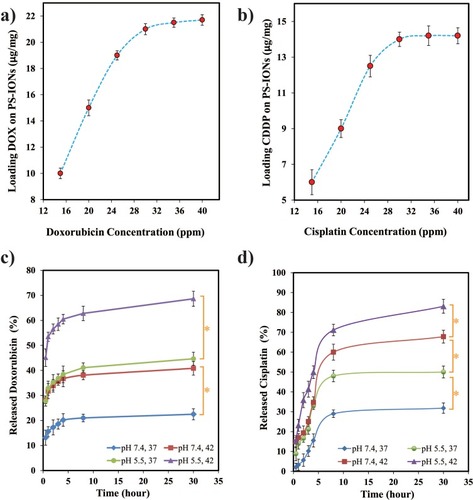
Figure 6 (a) T2-weighted MR images of PS-IONs in aqueous media at various concentrations and different echo times. (b) T2 relaxation rate (R2) versus iron concentration in PS-IONs.
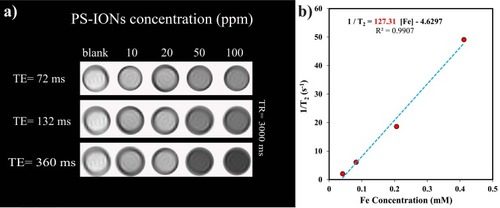
Figure 7 MTT viability assay of MCF7 cells after exposure to 0.5 W/cm2 near-IR laser irradiation for 10 min, incubation with 200 μg/mL of PS-IONs, chemotherapy with DOX (4.2 μg/mL) or CDDP (2.8 μg/mL), dual-drug chemotherapy, photothermal treatment, and multiple treatment method. Values are mean±SD. Double asterisks (**) indicate nonsignificant difference (P>0.05).
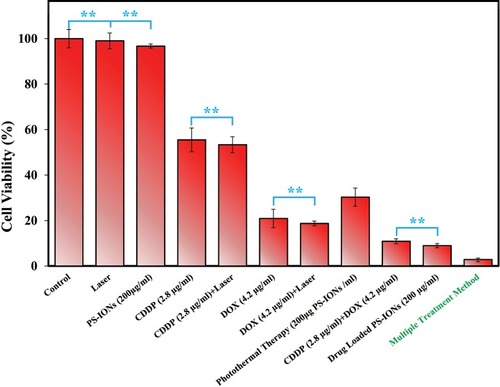
Table 3 Summary Of The Parameters And Outcomes Of Some SPION-Based Chemo-Photothermal Therapy Studies