Figures & data
Table 1 Properties of Zein Nanoparticles Used for Immunogenicity and Inflammatory Response Investigation
Figure 1 Zein-specific IgG titers in the sera of mice intramuscularly inoculated with the same dose (600 µg) of 250, 450, 750, or 850 nm zein particles at weeks 0, 1, and 3. The sera of all six mice in each group were separately evaluated three times by ELISA. Results are expressed as means of antibody titers calculated from six mice per group. *p-value <0.05 between two different groups.
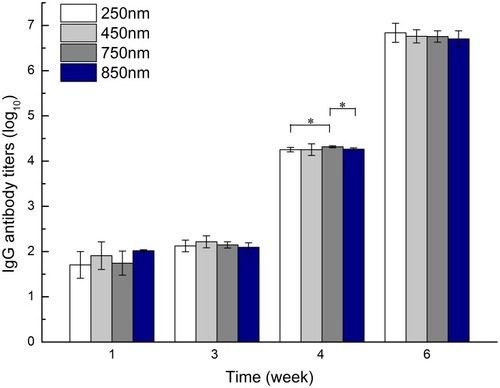
Figure 2 Body weight of mice intramuscularly inoculated with the same dose (600 µg) of 250, 450, 750, or 850 nm zein particles at weeks 0, 1, and 3. The control group followed the same inoculation scheme using the same volume of solvent instead of zein particles. All p-value calculations are based on the t-test of the two-sample equal variance hypothesis. *p < 0.05 compared to control.
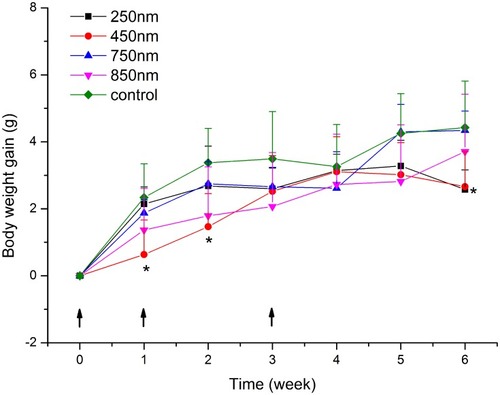
Figure 3 Zein-specific IgG titers in the sera of mice intramuscularly inoculated with either 200, 600, or 800 µg of 290 nm zein particles at weeks 0, 1, and 3. The sera of all six mice in each group were separately evaluated three times by ELISA. Results are expressed as means of antibody titers calculated from six mice per group. All p-value calculations are based on the t-test of the two-sample equal variance hypothesis. *, **, and *** indicates p < 0.05, p < 0.01, and p < 0.001, respectively.
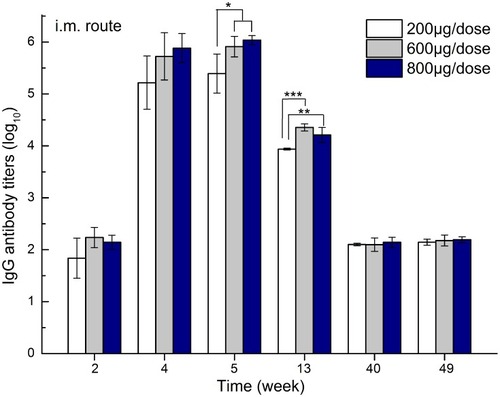
Figure 4 Zein-specific IgG1 (A), IgG2a (B), and IgG2b (C) OD values at 415 nm in the sera of mice intramuscularly inoculated with either 200, 600, or 800 µg of 290 nm zein particles at weeks 0, 1, and 3. The control group followed the same inoculation scheme using the same volume of solvent instead of zein particles. The sera of all six mice in each group were combined to form a serum pool and separately evaluated three times by ELISA. All p-value calculations are based on the t-test of the two-sample equal variance hypothesis. *, **, and *** indicates p < 0.05, p < 0.01, and p < 0.001, respectively, compared to the control at each time point. #, ##, and ### indicates p < 0.05, p < 0.01, and p < 0.001, respectively.
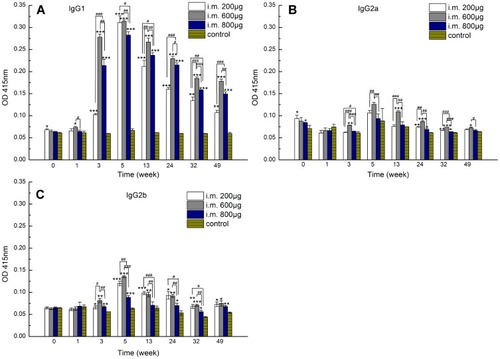
Figure 5 Zein-specific IgG titers in the sera of mice inoculated via intramuscular and subcutaneous routes with 600 µg of 290 nm zein particles at weeks 0, 1, and 3, respectively. The sera of all six mice in each group were separately evaluated three times by ELISA. Results are expressed as means of antibody titers calculated from six mice per group. All p-value calculations are based on the t-test of the two-sample equal variance hypothesis. *p < 0.05, and **p < 0.01.
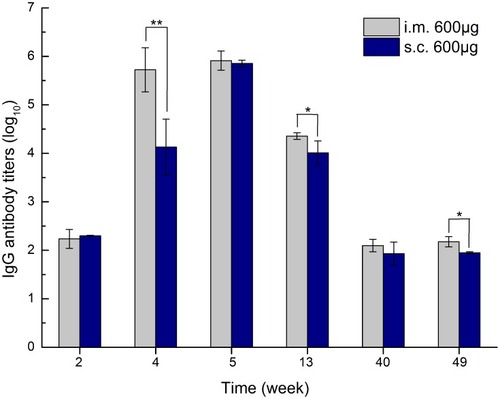
Figure 6 Hematoxylin and eosin-stained sections of muscle and skin from injection sites at days 1, 3, and 7 after inoculation. Mice were inoculated by injecting 800 µg of 311 nm zein particles into the left leg at day 0 via intramuscular or subcutaneous routes. Inflammatory cell infiltration (hollow arrows) and damaged muscle fiber (hollow stars) were located in the muscle tissues and dermis. a, stratum; b, epidermis; c, dermis; d, sebaceous glands; e, hair follicles containing hair fibers (bright color).
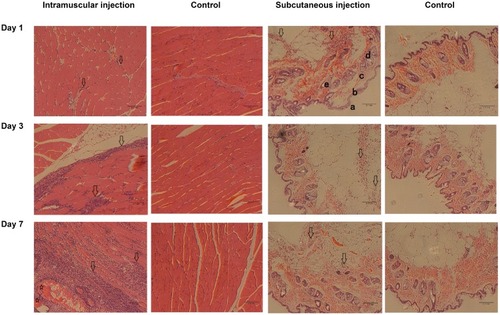
Figure 7 Zein-specific IgG titers in the sera of mice inoculated via intramuscular and subcutaneous routes with 200, 600, or 800 µg of 290 nm zein particles at weeks 0, 1, 3, and 50. The sera of all six mice in each group were separately evaluated three times by ELISA. Results are expressed as means of antibody titers calculated from six mice per group. All p-value calculations are based on the t-test of the two-sample equal variance hypothesis. ***p < 0.001.

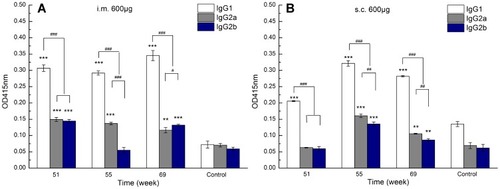
Figure 8 Zein-specific IgG1, IgG2a, and IgG2b OD values at 415 nm in the sera of mice inoculated via intramuscular (A) and subcutaneous (B) routes with 600 µg of 290 nm zein particles at weeks 0, 1, 3, and 50. The sera of all six mice in each group were combined to form a serum pool and separately evaluated three times by ELISA. All p-value calculations are based on the t-test of the two-sample equal variance hypothesis. ** and *** indicates p < 0.01 and p < 0.001, respectively, compared to the control. #, ##, and ### indicates p < 0.05, p < 0.01, and p < 0.001, respectively.