Figures & data
Figure 1 Schematic representation of the synthesis of drug dual-delivery system INR@FRT for synergistic photothermal-chemotherapy of ovarian cancer.
Abbreviations: GO, graphene oxide; NGO, nanosized graphene oxide; IR780, IR-780 iodide; NIR, near-infrared; RSV, resveratrol; FRT, ferritin.
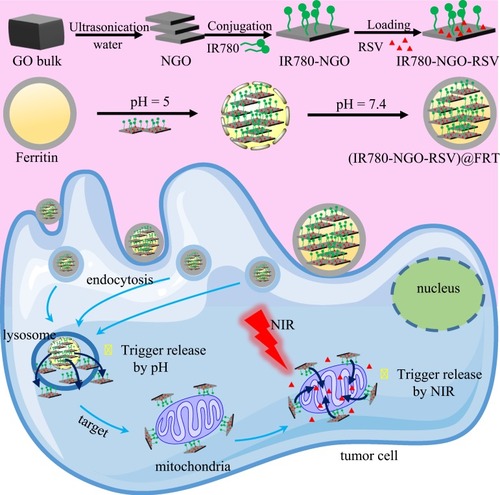
Figure 2 (A and B) The AFM image and height profile of NGO. (C and D) The AFM image and height profile of INR. (E and F) The AFM image and height profile of INR@FRT. (G) The size distribution of NGO, INR and INR@FRT. (H) The absorption spectra of RSV, NGO, IR780, and INR@FRT, respectively. (I) The hydrodynamic particle size change of INR@FRT in various media including water, FBS, cell media, and saline over 7 days.
Abbreviations: NGO, nanosized graphene oxide; IR780, IR-780 iodide; RSV, resveratrol; FRT, ferritin; AFM, atom force microscopy; FBS, fetal bovine serum.
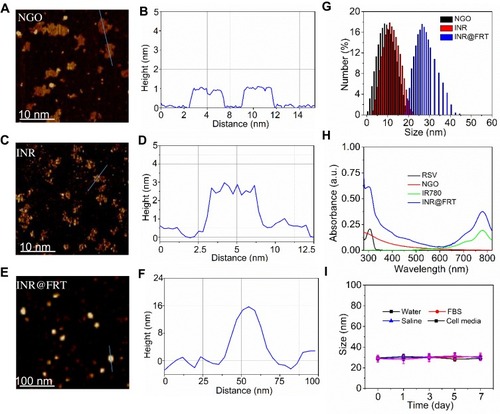
Figure 3 (A) Photothermal heating curves of FRT, NR@FRT and INR@FRT solution under 3 min 808 nm laser irradiation (0.3 W/cm2). (B) Temperature variations of NR@FRT and INR@FRT after the continuous irradiations of 3 min 808 nm laser for 5 cycles. (C) The size change of INR@FRT from 25°C to 85°C. **P<0.01, vs other groups.
Abbreviations: NGO, nanosized graphene oxide; IR780, IR-780 iodide; RSV, resveratrol; FRT, ferritin.
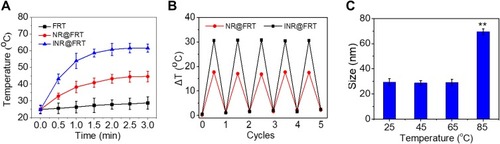
Figure 4 (A) Release kinetics of RSV from INR@FRT in pH 9.0, 7.4, 6.5 and 5.0. (B) Release kinetics of RSV from INR@FRT in PBS buffer (pH = 7.4 and 5.0) with 3 min NIR irradiation (808 nm, 0.3 W/cm2). (C) Release kinetics of IR780 from INR@FRT in pH 7.4 and 5.0 combined with 3 min NIR irradiation (808 nm, 0.3 W/cm2). The arrows represent the NIR irradation.
Abbreviations: IR780, IR-780 iodide; RSV, resveratrol.
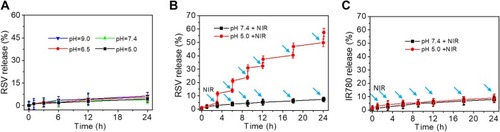
Figure 5 (A and B) The fluorescence images of SKOV-3 cells incubated with FITC-labeled NR@FRT and INR@FRT for 4 hrs. Scale bar=60 μm. (C) Flow cytometry measurement of cellular FITC fluorescence intensities in SKOV-3 cells after incubation with free FITC and FITC-labeled NR@FRT and INR@FRT. *P<0.05, **P<0.01. (D) The corresponding co-localization coefficient of FITC-labeled FITC-labeled NR@FRT and INR@FRT with lysosome and mitochondria in cells in A and B. **P<0.01. (E and F) The bio-TEM image of INR@FRT treated cells.
Abbreviations: NGO, nanosized graphene oxide; FRT, ferritin; IR780, IR-780 iodide; RSV, resveratrol; FITC, fluorescein isothiocyanate; DAPI, 4ʹ,6-diamidino-2-phenylindole; MI, mitochondria; Ly, lysosome.
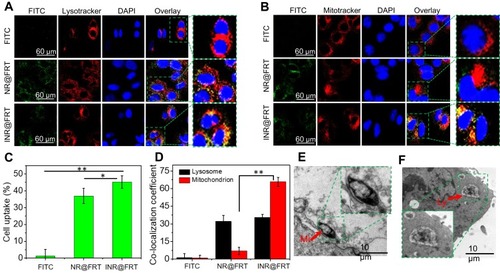
Figure 6 (A) Thermal images of PBS, NR@FRT, and INR@FRT treated cells after 3 min NIR irradiation, and (B) the corresponding temperature change curves. (C) In vitro cytotoxicity against SKOV-3 cells treated with different concentrations of INR@FRT for 24 h and 48 h. (D) In vitro cytotoxicity against SKOV-3 cells treated with different concentrations of RSV for 24 h and 48 h. In vitro cytotoxicity against SKOV-3 cells treated with different concentrations of NR@FRT and INR@FRT with or without NIR irradiation for (E) 24 h and (F) 48 h. **P<0.01, vs the other groups at the same concentration.
Abbreviations: NGO, nanosized graphene oxide; FRT, ferritin; IR780, IR-780 iodide; RSV, resveratrol; NIR, near-infrared.
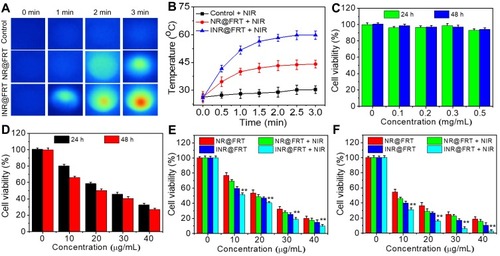
Figure 7 (A) The calcium AM/PI dual-staining images of cells after treatment by control (PBS), free RSV, IN@FRT, INR@FRT, NR@FRT + NIR, and INR@FRT + NIR (with the same RSV concentration 40 μg/mL) for 48 h, respectively. (B) Cell apoptosis and (C) corresponding apoptosis rate of cells treated with PBS (control), free RSV, IN@FRT, INR@FRT, NR@FRT + NIR, and INR@FRT + NIR (with the same RSV concentration 40 μg/mL) for 48 h by flow cytometry, respectively. **P<0.01, vs the other groups. (D) The change of MMP of SKOV-3 cells treated with PBS (control), free RSV, IN@FRT, INR@FRT, NR@FRT + NIR, and INR@FRT + NIR (with the same RSV concentration 40 μg/mL) for 48 h by flow cytometry, respectively. The NIR irradiation uses 808 nm laser at 0.3 W/cm2 for 3 min. **P<0.01, vs the other groups.
Abbreviations: NGO, nanosized graphene oxide; FRT, ferritin; IR780, IR-780 iodide; RSV, resveratrol; NIR, near infrared; MMP, mitochondrial membrane potential.
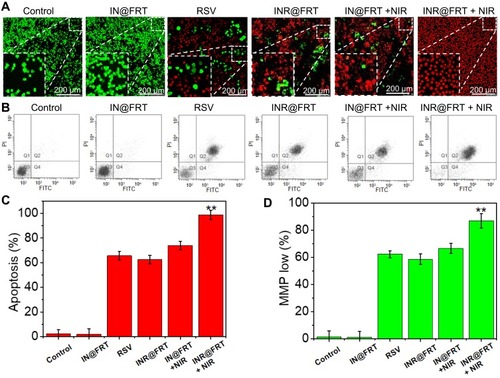
Figure 8 (A) Blood circulation curves of free RSV and INR@FRT in mice after intravenous injection determined by the RSV absorbance from diluted tissue lysate (The accumulation of RSV was calculated to be ID% per gram (the percentage of the injected dose per gram of tissue). (B) Content of NR@FRT and INR@FRT in major organs and tumor at 24 h post-treatment with nanoparticles determined by the RSV absorbance from diluted tissue lysate. **P<0.01.
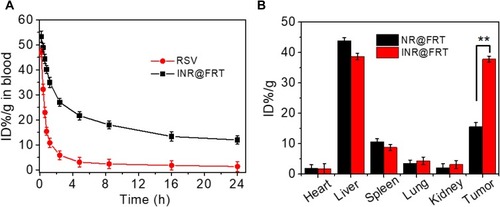
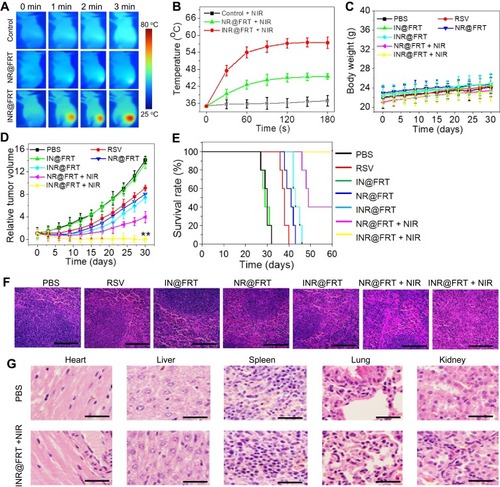
Figure 9 (A) The thermal images and (B) corresponding temperature statistical results of tumor-bearing mice post-tail vein injection of control PBS, NR@FRT and INR@FRT at 24 h under 3 min NIR irradiation (808 nm, 0.3 W/cmCitation2), respectively. (C) Body weight of tumor-bearing mice after various treatments. (D) The growth profile of SKOV-3 xenografted tumors after intravenous injection of PBS, RSV, IN@FRT, NR@FRT, INR@FRT, NR@FRT + NIR and INR@FRT + NIR (808 nm, 0.3 W/cmCitation2). **P<0.01, vs the other groups. (E) The survival rate of tumor-bearing mice after various treatments for 60 days. (F) Micrographs of H&E-stained tumor slices collected from PBS-, RSV-, IN@FRT-, NR@FRT-, INR@FRT-, NR@FRT + NIR- and INR@FRT + NIR- (808 nm, 0.3 W/cm2) treated groups at the end of the treatment. Scale bar = 50 μm. (G) H&E-stained tissue sections of major organs, including the heart, liver, spleen, lung, and kidney from tumor-bearing mice in saline (control) and INR@FRT + NIR groups after the treatment. Scale bar = 100 μm.
Abbreviations: NGO, nanosized graphene oxide; FRT, ferritin; IR780, IR-780 iodide; RSV, resveratrol; NIR, near-infrared.