
Figures & data
Table 1 Experimental Grouping For Toxicity Analysis
Table 2 Experimental Grouping For Therapeutic Analysis
Figure 1 Color transformation of selenium nanoparticle reaction mixture from yellow to brick red depicting successful synthesis of selenium nanoparticles.
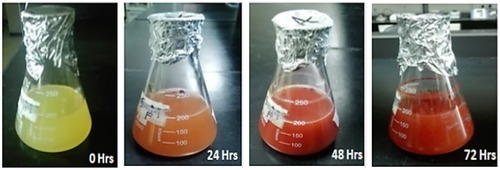
Figure 2 (A) Ultraviolet-visible spectrum of Foeniculum vulgare Mill. seed extract depicting presence of multiple peaks indicating various constituent compounds. (B) Ultraviolet-visible spectrum of selenium nanoparticle reaction mixture indicating specific selenium nanoparticle absorbance peak at 275 nm.
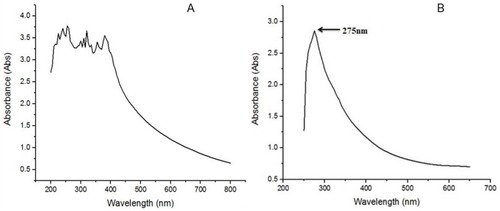
Figure 3 (A) Infrared spectrum of Foeniculum vulgare Mill. seed extract prior to its interaction with sodium selenite solution. (B) Infrared spectrum of selenium nanoparticles reaction mixture synthesized after interaction of Foeniculum vulgare Mill. seed extract with sodium selenite solution.
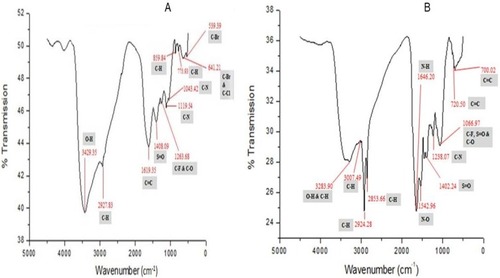
Figure 4 X-ray diffraction pattern of selenium nanoparticles derived from Foeniculum vulgare Mill. seed extract.
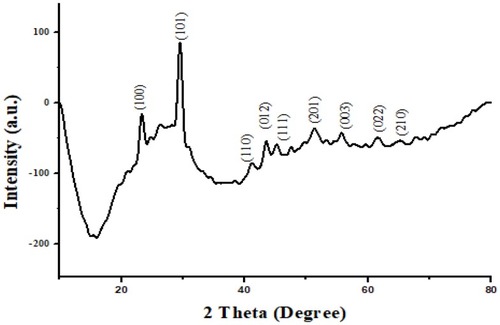
Figure 5 Scanning electron microscopic images of selenium nanoparticles derived from Foeniculum vulgare Mill. seed extract at 2 µm, 1 µm and 500 nm depicting spherical to irregular morphology of selenium nanoparticles.
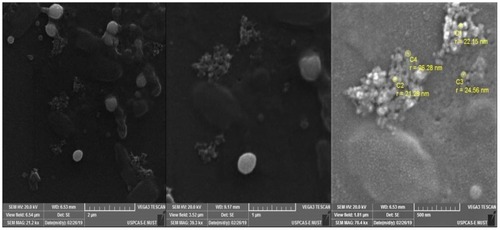
Figure 6 Energy Dispersive X-Ray Spectroscopy analysis graph depicting energy on X-axis and number of counts on Y-axis representing elemental composition of Foeniculum vulgare Mill.-derived selenium nanoparticles. Selenium spectrum peaks are shown by arrows.
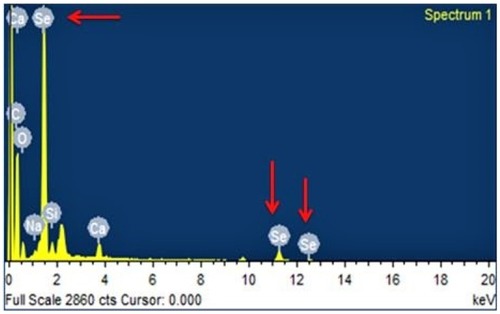
Table 3 Clinical Chemistry Parameters Of Healthy Mice Administered Four Doses Of SeNP (Toxicity Analysis)
Figure 7 Histopathological cross-sections of SeNP administered (doses 2.5 mg/kg, 5 mg/kg, 10 mg/kg and 20 mg/kg) mice spleens compared to healthy control spleen at magnification 4X depicted clearly defined red and white pulp in all mice groups (A, B, C, D, E). Histological longitudinal sections of SeNP administered (doses 2.5 mg/kg, 5 mg/kg, 10 mg/kg and 20 mg/kg) mice livers compared to healthy control liver depicted intact hepatocellular morphology at 40X magnification in all mice groups (F, G, H, I, J). Histological bisections of SeNP-administered (doses 5 mg/kg, 10 mg/kg and 20 mg/kg) mice kidneys compared to healthy control kidney at 40X magnification depicted intact glomerular structures (K, M, N, O). Mice administered 2.5 mg/kg dose of selenium nanoparticles showed somewhat distorted glomeruli (L).
Abbreviation: SeNP, selenium nanoparticles.
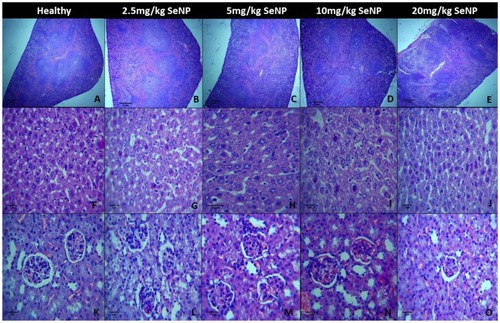
Figure 8 (A) Asterisks (***) indicate significant increase (P < 0.001) in paw volume at day 14, 21 and 28 during rheumatoid arthritis induction period. (B) Ventral and dorsal view of paw of a healthy mouse and a mouse with rheumatoid arthritis.
Abbreviation: RA, rheumatoid arthritis.
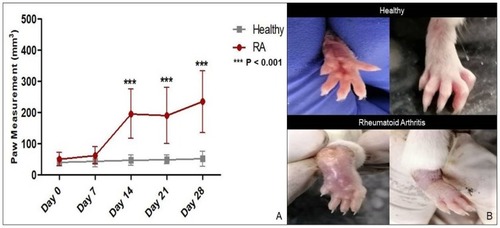
Figure 9 (A) Reduction in paw volume in 5mg/kg SeNP (P <0.05), 10mg/kg SeNP (P < 0.01) and leflunomide (P<0.001) treated groups as compared to arthritic control group. (B) Ventral and dorsal paw view of arthritic group compared to groups treated with 5mg/kg SeNP, 10mg/kg SeNP and leflunomide.
Abbreviations: SeNP, selenium nanoparticles; RA, rheumatoid arthritis.
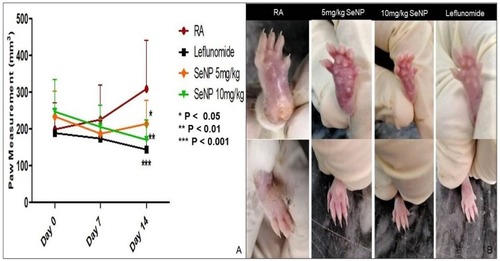
Figure 10 A comparative histological analysis of paw tissues from the treated and untreated groups of mice. Bone erosion and distorted cellular morphology are visible in arthritic mice (RA), whereas selenium nanoparticles treated groups display somewhat restored cellular morphology.
Abbreviations: RA, rheumatoid arthritis; SeNP, selenium nanoparticles.
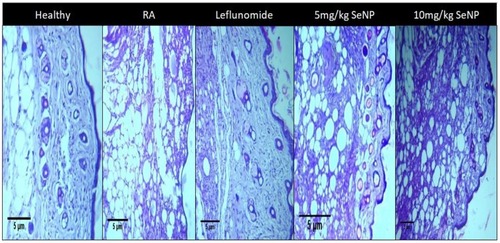
Figure 11 Graph depicts DPPH radical scavenging activity of 5 mg/kg SeNP, 10 mg/kg SeNP and leflunomide in serum as compared to untreated arthritic mice serum. Leflunomide showed most significant antioxidant activity (P < 0.01) shown by ** in graph. SeNP in 10 mg/kg dose showed significant antioxidant activity (P < 0.05) shown by * in graph. 5mg/kg SeNP showed non-significant antioxidant activity.
Abbreviations: RA, rheumatoid arthritis; SeNP, selenium nanoparticles.
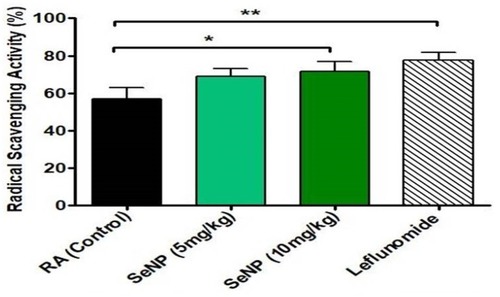
Figure 12 Catalase activity shown by treated mice liver tissues compared to untreated mice liver tissue. Variation in catalase activity values was not significant.
Abbreviations: RA, rheumatoid arthritis; SeNP, selenium nanoparticles.
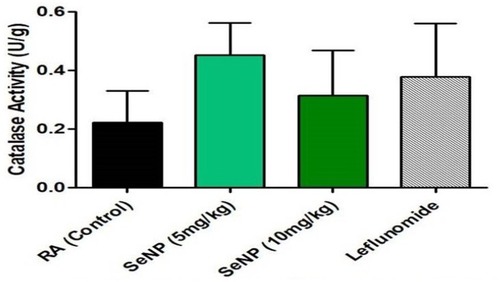
Figure 13 Spleen Indices of selenium nanoparticles (5 mg/kg and 10 mg/kg) and leflunomide-treated groups in comparison with healthy control and untreated arthritic group. There was no significant difference in spleen index of any experimental group compared to the control group depicting that selenium nanoparticles did not cause splenomegaly.
Abbreviations: RA, rheumatoid arthritis; SeNP, selenium nanoparticles.
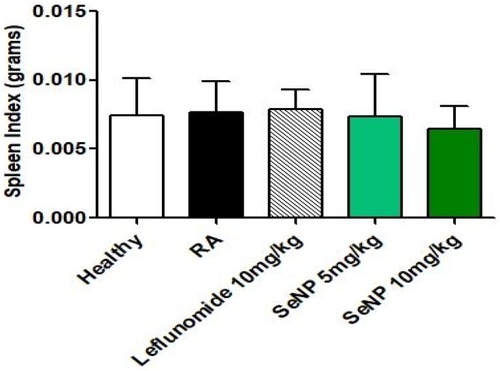
Table 4 Clinical Chemistry Parameters Of SeNP-Treated And SeNP-Untreated Arthritic Mice (Therapeutic Analysis)