Figures & data
Figure 1 Structure of paeonol.
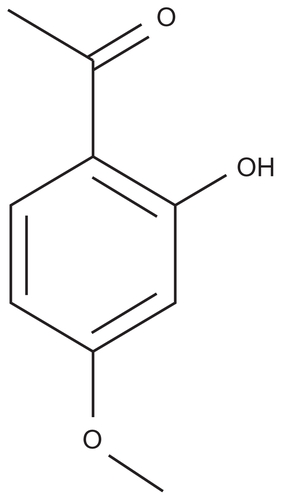
Table 1 Compositions of various topical formulations for paeonol delivery
Figure 2 Pseudoternary phase diagrams of microemulsion composed of isopropyl myristate, surfactant (Crel), cosurfactant (PEG400) and water.
Note: Black area represents o/w microemulsion region; Km = S/Cos.
Abbreviations: CEL, Cremophor EL®, polyoxyethylated castor oil; Crel, Cremophor EL; IPM, isopropyl myristate; o/w, oil in water; PEG 400, polyethylene glycol.
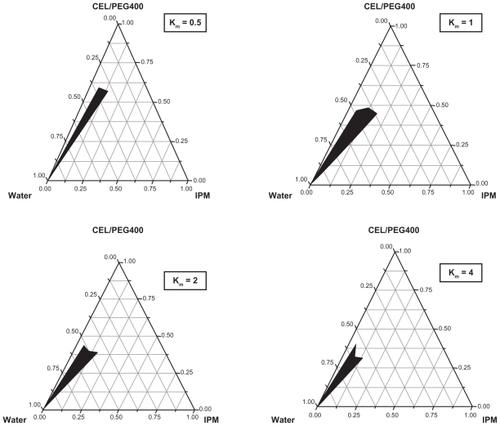
Figure 3 Transmission electron microphotography of paeonol microemulsion.
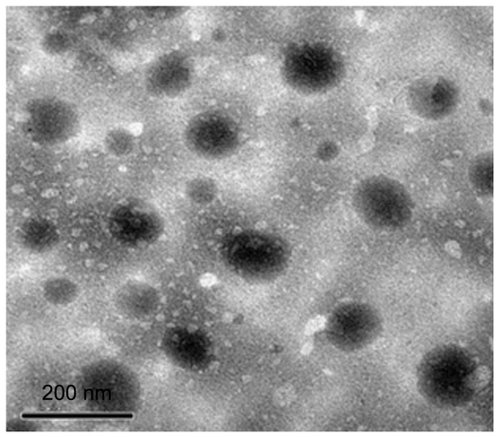
Table 2 Permeability coefficient and enhancement ratio of paeonol through excised rat skin from different vehicles
Figure 4 The cumulative amount of paeonol from cubic gel (-●-) and microemulsion gel (-▴-) and control solution (-♦-).
Note: Results are expressed as means ± standard deviation of at least three experiments.
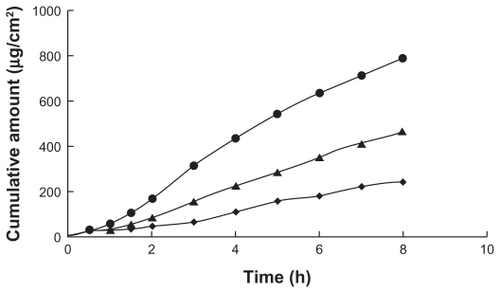
Table 3 Pharmacokinetic parameters obtained after oral and transdermal administration of paeonol in rats
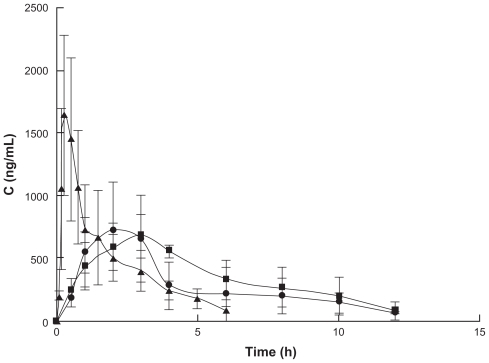
Figure 5 Plasma concentration of paeonol following oral and transdermal administration to rats.
Notes: Means ± standard deviation; n = 6; -▴-, oral administration; -●-, microemulsion gel transdermal administration; -■-, cubic gel transdermal administration.