Figures & data
Table 1 The solubility of FEX in various vehicles at 25°C
Table 2 The contents of optimized microemulsion formulation
Figure 1 Pseudoternary phase diagrams of microemulsion system. (A) 1:1 S/coS ratio, (B) 2:1 S/coS ratio, (C) 3:1 S/coS ratio, (D) 4:1 S/coS ratio, (E) 5:1 S/coS ratio.
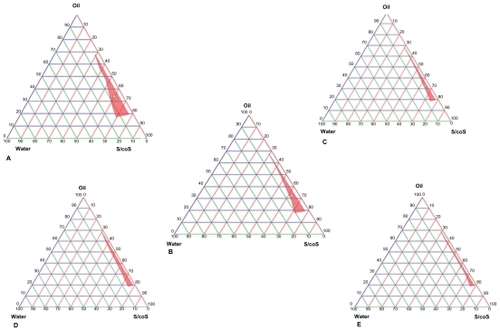
Table 3 Characterization of microemulsion
Table 4 Stablity of optimum microemulsion containing FEX (A) and (B)
Table 5 The permeability value of FEX with different formulations (n = 6 ± SD)
Figure 2 The amount of FEX permeability across Caco-2 cell (n = 6 ± SD).
Notes: A to B for SY = The amount of FEX from apical to basolateral direction of syrup, B to A for SY = The amount of FEX from basolateral to apical direction of syrup, A to B for ME = The amount of FEX from apical to basolateral direction of microemulsion, B to A for ME = The amount of FEX from basolateral to apical direction of microemulsion.
Abbreviations: A, apical; B, basolateral; FEX, fexofenadine; ME, microemulsion; SD, standard deviation; SY, syrup.
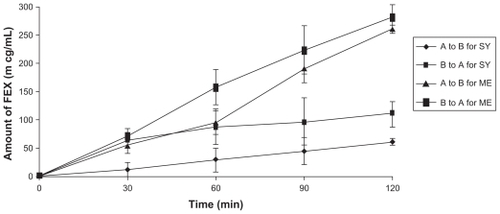
Table 6 The % TEER change of experiments across Caco-2 cell for both directions with ± SD (A → B: Apical to basolateral direction, B → A basolateral to apical direction)
Table 7 Parameters of the fit of the models with passive component an Michaelis–Menten component and goodness of fit indexes
Table 8 Pharmacokinetic results from curve fitting of in vivo plasma data after microemulsion and Fexofen® syrup administration (n = 6) with SD
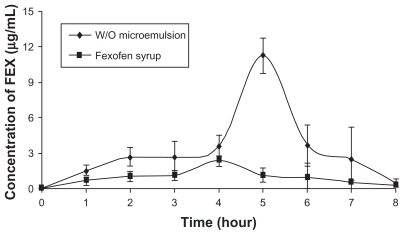
Figure 3 Comparison of the plasma concentration values obtained after administration of FEX loaded microemulsion and Fexofen®syrup.
Abbreviation: FEX, fexofenadine; w/o, water in oil.