Figures & data
Figure 1 Immunofluorescence staining of Schwann cells/astrocytes and schematic diagram of the magnetofection.
Notes: SC primary cultures stained for S100 (A), p75 (B), nuclei with DAPI (C), and merge file showed a purity of>95% SCs (D). Astrocyte primary cultures stained for GFAP (E), nuclei with DAPI (F) and merge file showed a purity of >90% astrocytes (G). Flowing chart of magnetofection (H). Scale bar (A–G), 100 μm.
Abbreviations: SCs, Schwann cells; DAPI, 4′,6-diamidino-2-phenylindole; SPIONs, superparamagnetic iron oxide nanoparticles
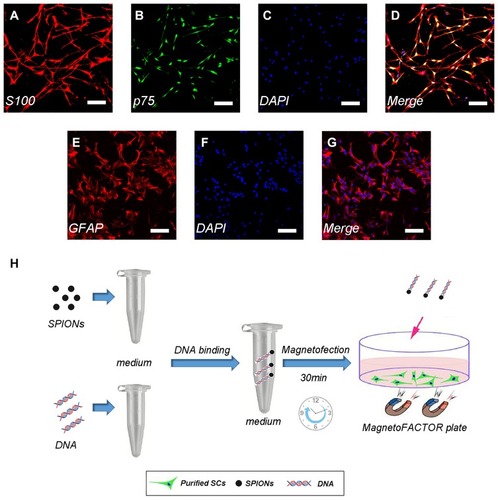
Figure 2 Characterization of PEI-SPIONs.
Notes: (A) TEM analysis of PEI-SPIONs. (B) Magnetization parameters of PEI-SPIONs. (C) Overall distribution of PEI-SPIONs sizes. (D) Zeta potential of PEI-SPIONs. (E) Overall distribution of PEI-SPIONs/ChABC complex sizes. (F) Zeta potential of the PEI-SPIONs/ChABC complex.
Abbreviations: avg, average; PEI-SPIONs, polyethylenimine-coated superparamagnetic iron oxide nanoparticles; TEM, transmission electron microscopy
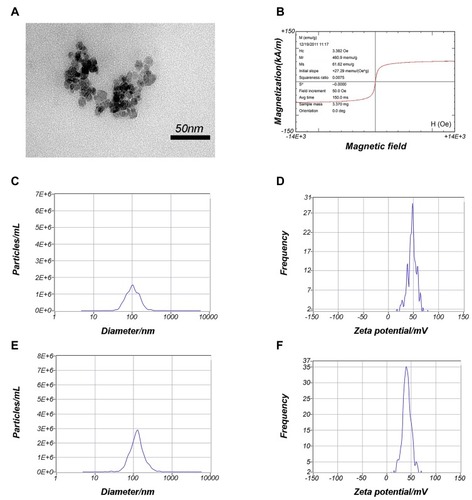
Figure 3 Cellular internalization of PEI-SPIONs.
Notes: (A) SEM of SCs in the normal control group; no relevant particles were detected on the surface of the cells. (B, C) At 6 hrs after magnetofection (PEI-SPIONs, 2 μg/mL); red arrows indicate PEI-SPIONs on the surface of cells. (D) No PEI-SPIONs in the cytoplasm of normal control SCs detected through TEM. (E, F) At 24 hrs after magnetofection (PEI-SPIONs, 2 μg/mL); white arrows indicate the internalized PEI-SPIONs in the cytoplasm. (F) Higher magnification of the boxed area in (E). Abbreviations: PEI-SPIONs, polyethylenimine-coated superparamagnetic iron oxide nanoparticles; SCs, Schwann cells; SEM, scanning electron microscopy; TEM, transmission electron microscopy.
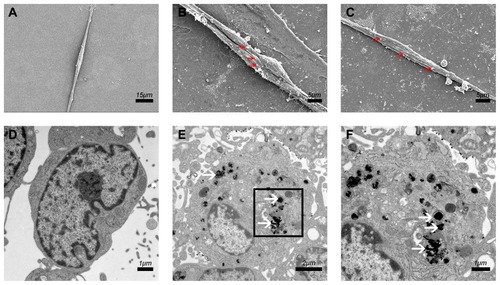
Figure 4 Cytotoxicity tests of PEI-SPIONs in SCs.
Notes: Detection of cytotoxicity of SPIONs through LIVE/DEAD cell staining and the CCK-8 assay. Staining images of the LIVE/DEAD assay at 24 hrs (A–E) and 72 hrs (F–J) after transfection of SCs with different concentrations of SPIONs. (K) The percentage of dead cells was measured via the LIVE/DEAD assay. Live cells were stained green, while dead cells were stained red. (L) Cell viability was estimated using the CCK-8 assay. Scale bar: (A–J) 100 μm. Graph bars: mean±SD; ***p<0.005 for comparison with 0 μg/mL group.
Abbreviations: CCK-8, cell counting Kit 8; PEI-SPIONs, polyethylenimine-coated superparamagnetic iron oxide nanoparticles; SCs, Schwann cells; SD, standard deviation.
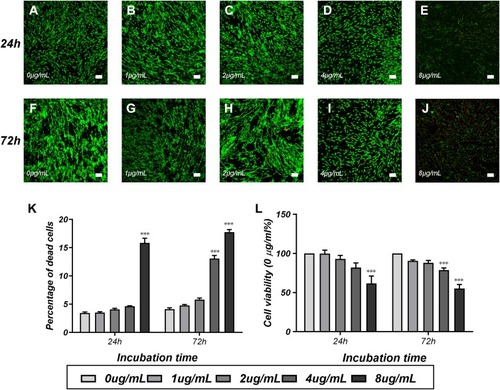
Figure 5 Expression of transferred exogenous ChABC in SCs.
Notes: (A) At 72 hrs after magnetofection, mRNA levels of ChABC in each group (normalized to normal control SCs). (B) At 72 hrs after magnetofection, detection of ChABC expression in SC, PEI-SPIONs/DNA/SC, and PEI-SPIONs/ChABC/SC by Western blotting.
Abbreviations: mRNA, messenger RNA; PEI-SPIONs, polyethylenimine-coated superparamagnetic iron oxide nanoparticles; ChABC, chondroitinase ABC; SCs, Schwann cells.
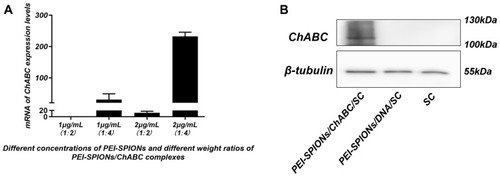
Figure 6 Activity and function assay of ChABC expressed by magnetofected SCs in vitro.
Notes: (A–C) After CS56 (green) and GFAP (red) staining, the immunoreactivity in spinal cord sections incubated with conditioned medium from ChABC-magnetofected SC culture (B) and purified ChABC (C) was decreased compared with that observed in cells treated with PBS (A). (D–F) After CS56 (green), GFAP (red) staining and merge file, the immunoreactivity in a slide of astrocytes. (G) The DMB assay demonstrated the enzymatic activity of ChABC in conditioned medium from PEI-SPIONs/ChABC/SC cultures, control cell culture medium or nontransduced SC cultures. Data were presented as the mean±SEM; n=6 per each SC group. ***p<0.005 for comparison with medium group. Scale bar (A–C), 100 μm. Scale bar (D–F), 50 μm.
Abbreviations: GFAP, glial fibrillary acidic protein; CS56, monoclonal anti-chondroitin sulfate; PEI-SPIONs, polyethylenimine-coated superparamagnetic iron oxide nanoparticles; ChABC, chondroitinase ABC; SCs, Schwann cells.
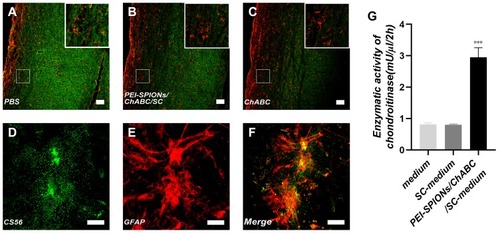
Figure 7 Typical images of SC migration on an astrocyte monolayer in the inverted coverslip migration assay.
Notes: (A–F) SCs were labeled with S100 (green) and DAPI (blue), while astrocytes were labeled with the nucleus staining solution DAPI (blue) only. White arrows indicate the direction of the applied MF. (F) The migration of PEI-SPIONs/ChABC/SC on the astrocyte monolayer was significantly enhanced and oriented parallel to the direction of the magnetic force in the presence of an external MF. (G) SC migration orientation index. The box-plot showed the median, interquartile ranges, maximum and minimum. (H) Average maximum distances of migration from the edge of the inverted fragments. (I) Number of SCs (normalized to the control SC) grouped into classes of angles formed by the long axis of SCs and the direction of the external MF. (J) Number of SCs reaching different specific distances from the edge of an inverted fragment. Scale bar: (A–F) 100 μm. Graph bars: mean ± SD; *p<0.05, **p<0.01, ***p<0.005 for comparison with SC group.
Abbreviations: DAPI, 4′,6-diamidino-2-phenylindole; MF, magnetic field; ns, not significant; PEI-SPIONs, polyethylenimine-coated superparamagnetic iron oxide nanoparticles; ChABC, chondroitinase ABC; SCs, Schwann cells; SD, standard deviation.
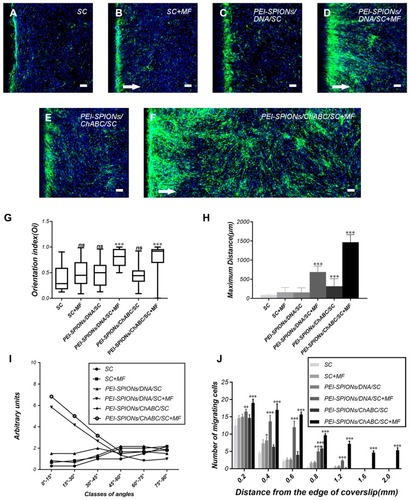
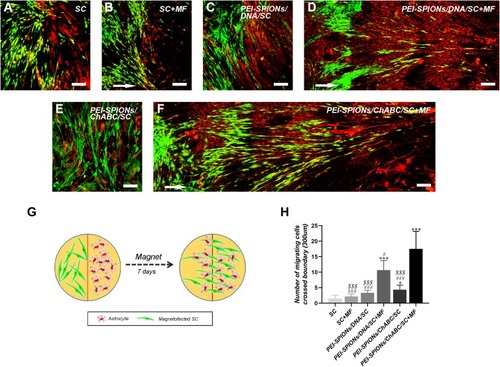
Figure 8 Confrontation assays of SCs and astrocytes.
Notes: Immunocytochemistry images of the SC–astrocyte confrontation assay. SCs were labeled with S100 (green); while astrocytes were labeled with GFAP (red). (A–F) Arrows indicated the direction of the MF. (A, B) SC with or without an applied MF; boundaries were formed by astrocytes; (C) PEI-SPIONs/DNA/SC formed a boundary with astrocytes in the absence of an applied MF; (D) PEI-SPIONs/DNA/SC crossed the cell boundary in the presence of an MF. (E) PEI-SPIONs/ChABC/SC migrated into the astrocyte domain without a specific direction. (F) PEI-SPIONs/ChABC/SC broke the boundary formed with astrocytes and aligned preferentially along the axis of the magnetic force under an applied MF. (G) Schematic diagram of the SC–astrocyte confrontation assay. Magnetofected SCs and astrocytes were plated in parallel strips; both were allowed to grow and migrate for 7 days under an applied MF. (H) Quantification of SCs that crossed the boundary and migrated into the astrocyte domain. The number of PEI-SPIONs/ChABC/SC with an applied MF far exceeded those of the other groups. Scale bar: (A–F) 100 μm. Graph bars: mean±SD; *p<0.05, ***p<0.005 for comparison with SC group; #p<0.05, ###p<0.005 for comparison with PEI-SPIONS/ChABC/SC+MF group; $$$p<0.005 for comparison with PEI-SPIONS/DNA/SC+MF group.
Abbreviations: GFAP, glial fibrillary acidic protein; MF, magnetic field; ns, not significant; PEI-SPIONs, polyethylenimine-coated superparamagnetic iron oxide nanoparticles; ChABC, chondroitinase ABC; SCs, Schwann cells; SD, standard deviation.