Figures & data
Figure 1 Schematic illustration of the synthesis of PGA-4HGF and its sustained release under physiological pH condition.
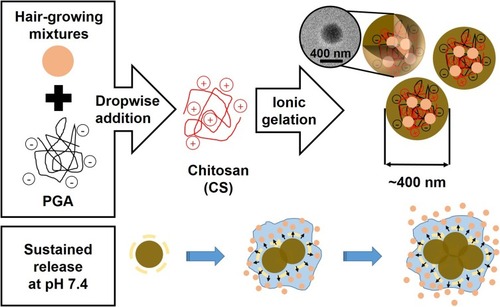
Figure 2 (A) Real image, (B) TEM image, and (C) SEM image of PGA-4HGF, and (D) real image, (E) TEM image, and (F) SEM image of PGA-control without 4HGF.
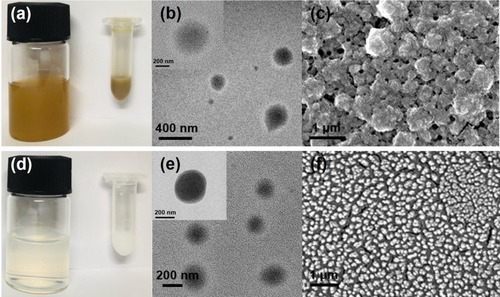
Table 1 (a) Effect Of Mixing Ratio Of PGA, 4HGF, And CS Or Mg2+ On The Synthesis Of Hydrogel Nanoparticles. (b) Effects Of CS Concentrations On The Synthesis Of Hydrogel Nanoparticles
Figure 3 (A) Absorbance spectra of free 4HGF and (B) the corresponding standard curve of the concentration of 4HGF and absorption intensity measured at 400 nm. Release profiles of PGA-4HGF at (C) pH 7.4, (D) pH 4.0, and (E) hair follicles-like conditions (pH 5.5 & 37°C).
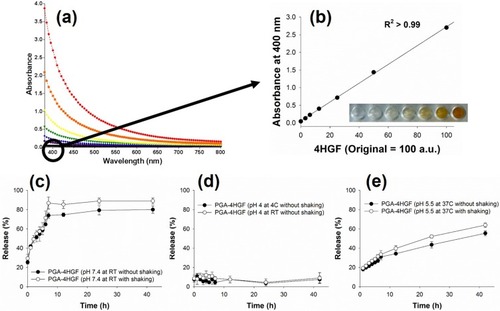
Figure 4 Penetration of FITC-labeled PGA-4HGF through the porcine skin after incubation with shaking (150 rpm) for (A) 0.5 hrs, (B) 3 hrs, and (C) 6 hrs, or without shaking for (D) 0.5 hrs, (E) 3 hrs, and (F) 6 hrs. Depth specifications: (A) 1: 15 µm, 2: 35 µm, 3: 85 µm, 4: 135 µm, 5: 185 µm, 6: 235 µm, and 7: 285 µm. (B) 1: 830 µm, 2: 860 µm, 3: 890 µm, 4: 950 µm, 5: 980 µm, 6: 1010 µm, and 7: 1070 µm. (C) 1: 1600 µm, 2: 1650 µm, 3: 1700 µm, 4: 1750 µm, 5: 1800 µm, 6: 1850 µm, 7: 1900 µm, 8: 1950 µm, and 9: 2000 µm. (D) 1: 0 µm, 2: 50 µm, 3: 100 µm, 4: 150 µm, 5: 200 µm, 6: 250 µm, 7: 300 µm, 8: 350 µm, and 9: 400 µm. (E) 1: 720 µm, 2: 750 µm, 3: 780 µm, 4: 840 µm, 5: 870 µm, 6: 900 µm, and 7: 960 µm. (F) 1: 910 µm, 2: 940 µm, 3: 970 µm, 4: 1030 µm, 5: 1060 µm, 6: 1090 µm, and 7: 1150 µm.
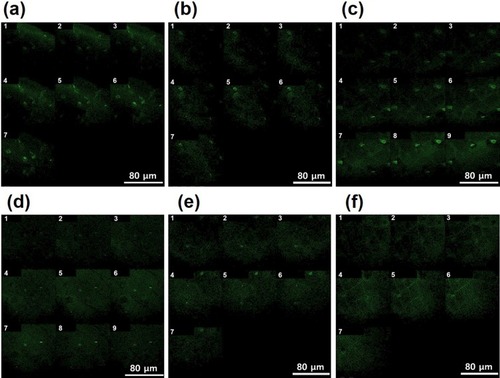
Figure 5 (A) Thermal stability by DPPH radical scavenging activity assay. (B) Average size and PDI values of PGA-4HGF during incubation in PBS (pH 7.4).
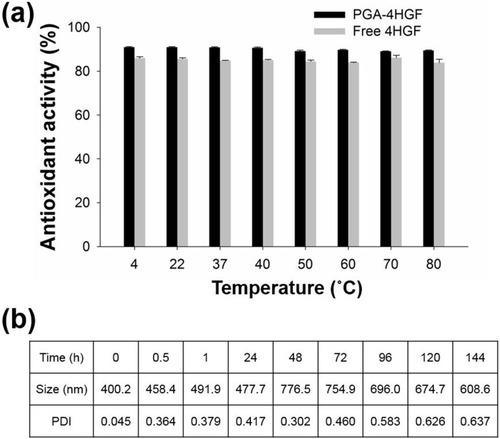
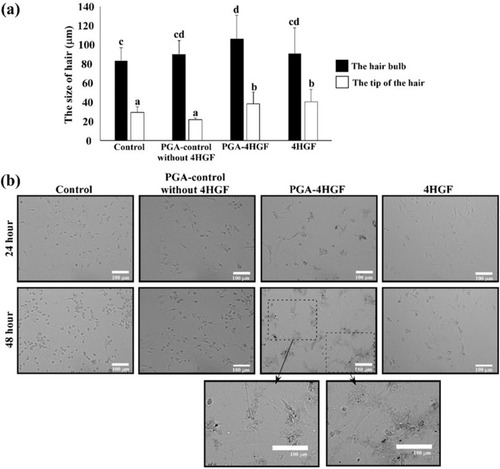
Figure 6 Effects of PGA-4HGF on: (A) the size of hair bulbs in mice and (B) the morphology of DPCs. In (A), data are represented as mean ± standard deviation (SD) (n > 30 hairs), and values with different alphabets in the same row were significantly different. Scale bar = 100 µm. Data were analyzed by one-way analysis of variance (ANOVA)/Duncan’s t-test. (p < 0.05).