Figures & data
Figure 1 Scanning electron microscopy images. (A) Unanodized Ti sample showing a nearly smooth surface at the nanometer level. (B) Ti sample anodized in 1% HF for 1 minute at 10 V showing a nanotextured non-nanotubular surface; the black arrows show the ridge-like nanotextures interspersed between the tiny holes. (C) Ti sample anodized with 1% HF for 10 minutes at 15 V showing nanotubes of 40–50 nm diameters. (D) Ti sample anodized with 1% HF for 10 minutes at 20 V showing nanotubes of 60–70 nm diameters. (E) Enlarged portion of nanotubes of 40–50 nm diameter. (F) Enlarged portion shows nanotubes 60–70 nm diameter (scale bar = 200 nm).
Abbreviations: HF, hydrofluoric acid; Ti, titanium.
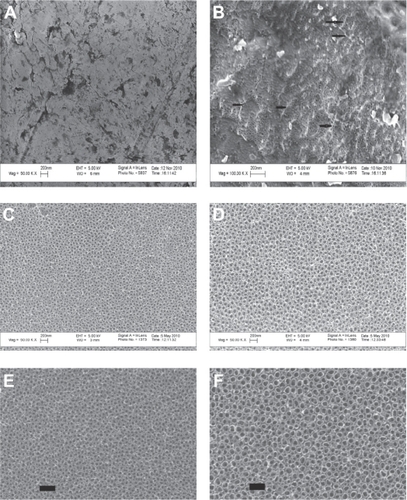
Table 1 Quantitative data obtained from atomic force microscopy analysis indicated that substrates created by anodization contained more nanofeatures than unanodized Ti
Table 2 Atomic percentages of elements in the outermost layers of Ti, as determined by electron spectroscopy for chemical analysis
Figure 2 Fluorescent microscopy images. (A) Adherent macrophages on unanodized Ti; round blue-green shape encircled by a red line shows a well spread macrophage. (B) Nanotextured, non-nanotubular Ti. (C) Nanotubular Ti with 40–50 nm diameters, after 24 hours of culture. (D) Nanotubular Ti with 60–70 nm diameters, after 24 hours of culture, showing macrophages (encircled in red lines) with little spreading.
Abbreviation: Ti, titanium.
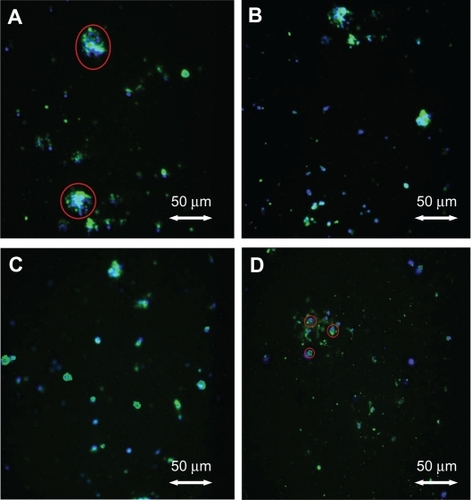
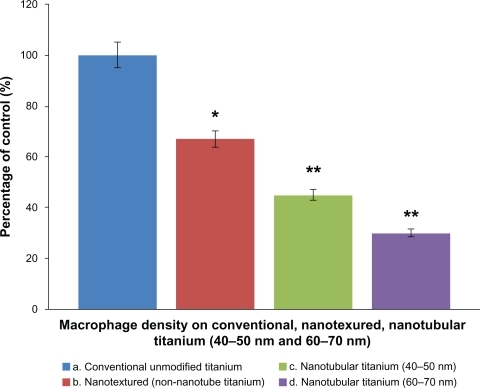
Figure 3 Macrophage density on conventional and anodized Ti samples. Macrophage density on conventional unmodified Ti, nanotextured non-nanotubular Ti and nanotubular Ti (tubes with diameters of 40–50 nm and 60–70 nm, respectively), n = 6, data are mean ± standard error of the mean.
Notes: **P < 0.0001, *P < 0.0002 compared with conventional unanodized Ti.
Abbreviation: Ti, titanium.