Figures & data
Figure 1 Characterization of multilayered Ti3C2Tx MXene films. (A) Photograph of the flexible freestanding MXene film. Scale bars: 5 mm (B) SEM image of the cross-section of MXene films. Scale bars: 1 μm. (C) SEM image of MXene films surface. Scale bars: 50 μm. (D) XRD pattern of Ti3C2Tx MXene and Ti3AlC2 MAX. (E) Water contact angles on Ti3C2Tx MXene films (n=3).
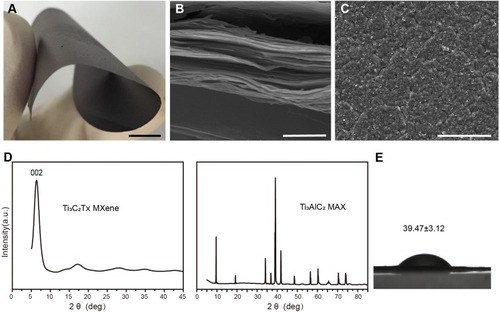
Figure 2 Cell adhesion, morphology, cytotoxicity and proliferation on MXene films. (A) Representative SEM images of cells attached on coverslips and MXene films surface after culturing for 24 hrs. Scale bars: 50 μm. (B) Representative images of cell morphology of cells seeded on MXene films and coverslips for 24 hrs. Green staining shows the cytoskeleton and blue staining indicates the nuclei. Scale bars: 50 μm. (C) Images of cells cultured on coverslips and MXene films for 24 hrs. The proliferating cells are labeled with EdU (green), nuclei are stained blue with Hoechst 33342. Scale bars: 100 μm. (D) EdU-positive ratio, calculated by counting the number of EdU-positive cells (green) per the total number of cells (blue), for cells cultured on coverslips and MXene films for 24 hrs. (n=5) (E) Live/Dead double staining, cells on coverslips and MXene films 24 hrs after seeding. Red staining represents dead cells while green fluorescence indicates live cells. Scale bars: 200 μm.
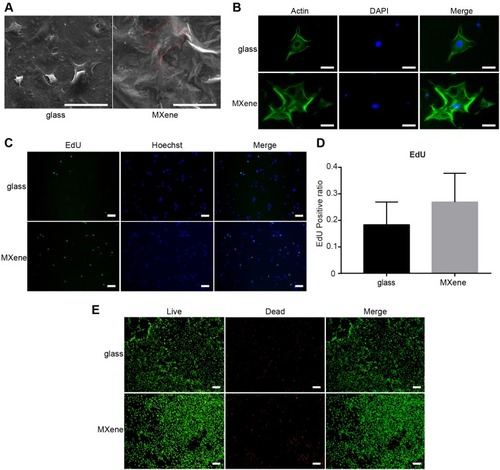
Figure 3 Enhanced osteogenic differentiation of MC3T3E1 cells cultured on MXene films. (A) The ALP activity of cells grown on coverslips and MXene films at 4 and 7 days after seeding in osteogenic medium or growth medium. (B) mRNA levels of the osteogenic differentiation-related genes ALP, OCN and OPN in cells cultured on coverslips and MXene films at 4 and 7 days after seeding in osteogenic medium. (*p<0.05, **p<0.01, ***p<0.001 and ****p<0.0001).
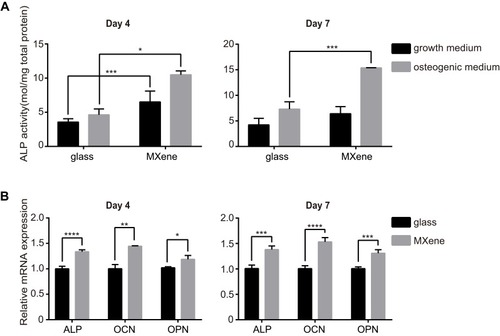
Figure 4 The host tissue response to MXene films. Histological sections of the tissue surrounding the MXene films after HE staining, 2 weeks after surgery. Macrophages (blue arrows) and many blood vessels (blue asterisks) were observed around the cracked MXene film chips. Blue arrows mark the macrophages and blue asterisks mark the blood vessels. Low magnification (A) Scale bar: 150 μm and high magnification (B) Scale bar: 50 μm.
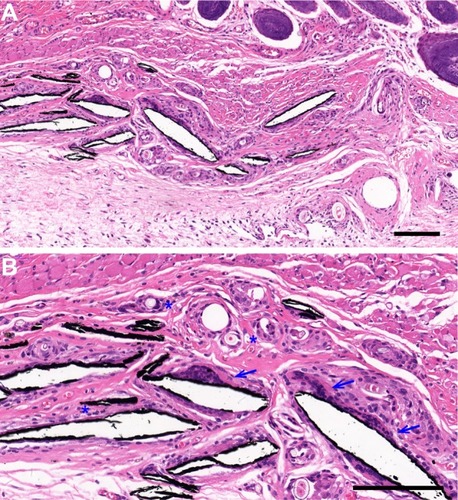
Figure 5 The bone regeneration performance of MXene film in vivo. (A) Surgical operation to create rat calvarial defect model and to cover the bone defects with MXene films. Scale bars: 5 mm. (B) Micro-CT reconstruction images of bone defect samples including interior, superficial, coronal and sagittal views at the 4th and 8th week after surgery. Scale bars: 5 mm. (C) Bone morphometric parameters including BVF, Tb.Th and Tb.Sp at 4 and 8 weeks after surgery. Note that BVF was significantly higher in MXene film group than in other groups. (**p<0.01, ***p<0.001 and ****p<0.0001).
Abbreviations: NB, new bone; Ti, titanium; Tb.Sp, trabecular separation; Tb.Th, trabecular thickness.
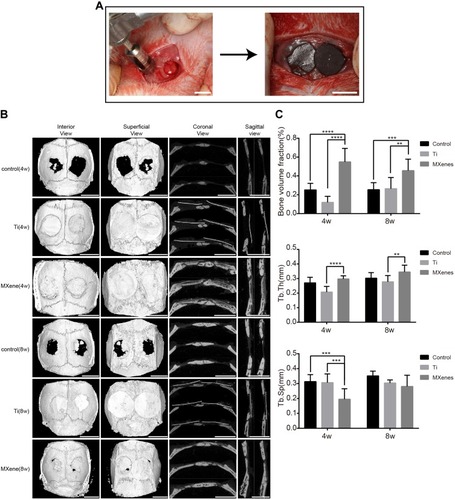
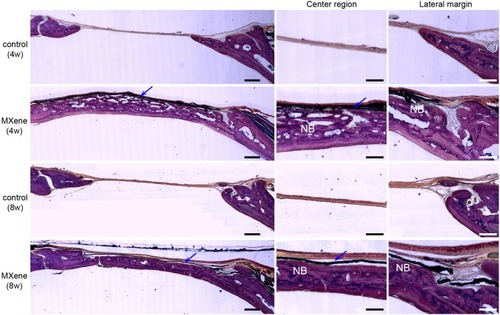
Figure 6 Undecalcified histological sections of calvarial samples 4 and 8 weeks after surgery following Van Gieson’s staining. Left images show the volume of newly formed bone with/without MXene films at low magnification. Scale bars: 500 µm. Right images show the newly formed bone (NB) in the central region and lateral margin of the bone defects under MXene films at high magnification. Blue arrows mark the MXene films. Scale bars: 200 µm.
Abbreviation: NB, new bone.