Figures & data
Table 1 Physico-Chemical Characterization of Unloaded and Quinine-Loaded Polymeric Nanocapsules and Nanospheres
Table 2 Mathematical Modeling of QN Photodegradation Profiles
Figure 1 Images obtained by the AFM for NCP80 (A), UNCP80 (B), NCEUD (C), and UNCEUD (D).
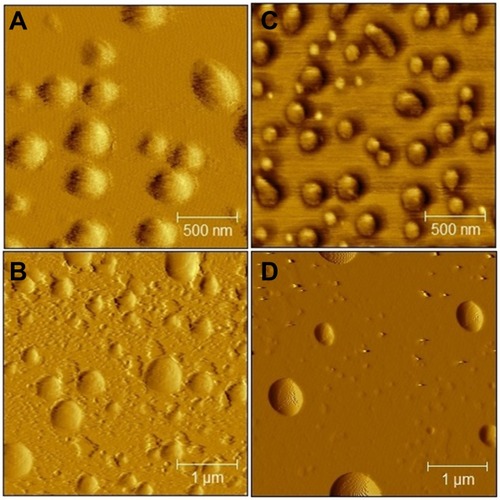
Table 3 QN Pharmacokinetic Parameters in Plasma After 20 mg/kg i.v. Bolus Dosing to Plasmodium berghei-Infected Rats
Figure 2 (A) POP pk fit mean (± standard deviation) plasma–time profiles of free quinine, NCP80, and NCEUD after a single 20 mg/kg intravenous dose in Wistar rats infected with P. berghei. (B) Visual predictive check.
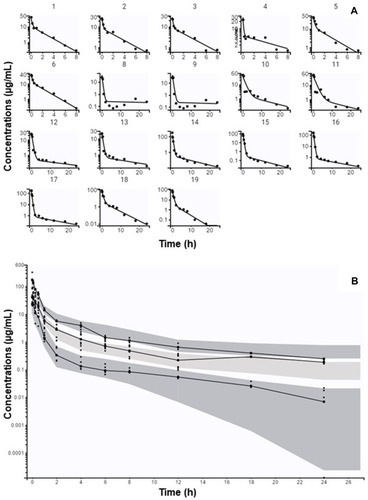
Table 4 Parameter Estimates of the Final Quinine Population Pharmacokinetic Model
Table 5 Efficacy of Different Treatments in Swiss Mice Experimentally Infected with Plasmodium Berghei
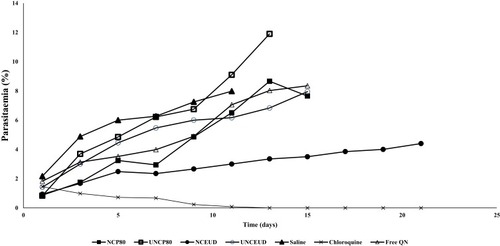
Figure 3 Profile of Parasitemia for evaluation of the antimalarial efficacy of the groups in P. berghei-infected Wistar rats (n = 6 per group).