
Figures & data
Table 1 Glucose Release Percentages of the Complexes Treated in Various pH and Temperature Conditions After 24 Days (Stability Tests)
Table 2 The Calculated IC50 Values for Various Compounds After 72 H by Fitting the Obtained Data to the Sigmoidal Dose-Response Curve
Figure 1 Dose-response curves for cisplatin (an anti-cancer drug), GCNPs, GPNPs, CNPs and PNPs in 72 h.
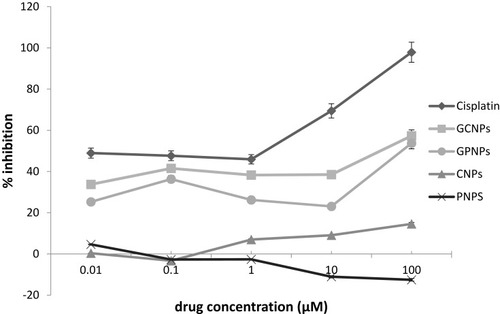
Figure 2 pH variations of treated cells culture media with GCNPs, GPNPs, RPMI as the negative control during MTT assay.
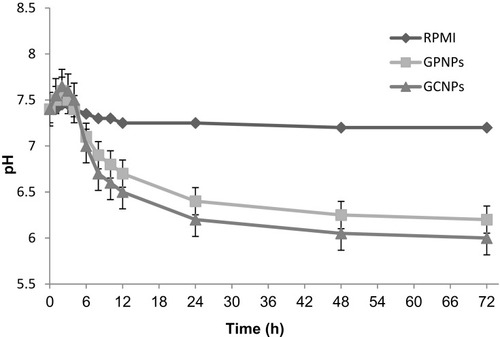
Figure 3 Cellular uptake of (A) FITC-PNPs and (B) FITC-GPNPs after 24 h.
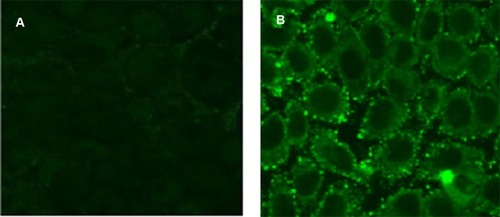
Figure 4 Analysis of apoptosis by the Annexin V-FITC binding assay. HT-29 cells were treated with (1) RPMI (control), (2) PNPs, (3) GPNPs and (4) cisplatin at IC50 concentrations of 72 h (2.54 µM for cisplatin and 85.01 µM for GPNPs and PNPs) for 72 h. Percentage of cells in viable, early apoptosis (Annexin +/PI-), late apoptosis (Annexin+/PI+), and necrosis (Annexin-/PI+) are shown after 72 h of treatment. Reported data are the mean values of three independent experiments performed in triplicate.
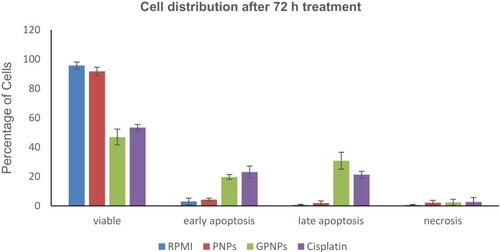
Figure 5 Effects of GPNPs treatment at 24 and 72 h on the expressions of GLUT-1 and GLUT-4 proteins in the HT-29 cell line.
