Figures & data
Table 1 Treatment Components for the Radiosensitization Effect Study
Figure 1 Theoretical dose enhancement factor (DEF) of each component at various energy ranges, with brachytherapy range at 0.38 MeV.
Notes: DEF of Cis and BiONPs is interpolated using the Sm and Pt database. The percentage of each component depended on the volume used during the irradiation.
Abbreviations: Zeff, effective atomic number; Sm, Samarium; Pt; platinum.
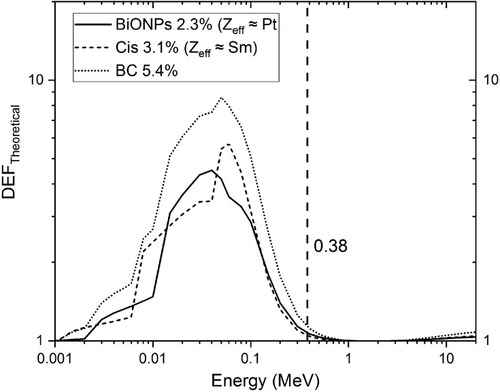
Figure 2 Percentage of cell viability after treatment with 60 nm BiONPs of different concentrations for 24, 48, and 72 hrs, on (A) MCF-7, (B) MDA-MB-231 and (C) NIH/3T3 cells.
Notes: Error bars represent the standard error of the mean (SEM).
Abbreviation: BiONPs, bismuth oxide nanoparticles.
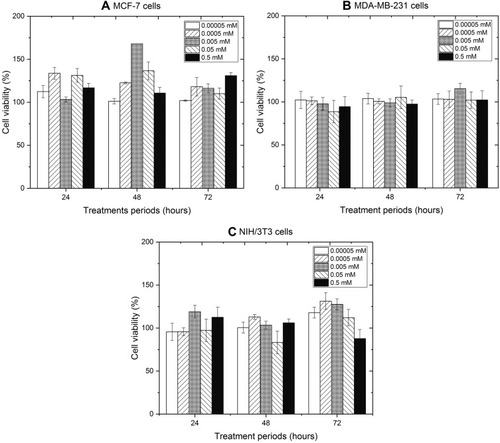
Figure 3 Localisation of BiONPs near the nuclei inside the (A) MCF-7, (B) MDA-MB-231 and (C) NIH/3T3 cells, after 24 hrs of incubation with 0.5 mMol/L of the BiONPs.
Notes: Arrows indicated the rod-shaped BiONPs. The scale of each picture is 20 µm.
Abbreviation: BiONPs, bismuth oxide nanoparticles.
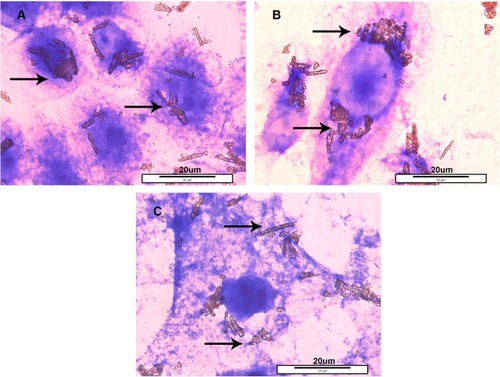
Figure 4 Cytotoxic evaluation of cisplatin against MCF-7, MDA-MB-231, and NIH/3T3 cell lines. Each point shows the percentage of viable cells in comparison to the negative control. Curves are fitted using the Dose-Response model.
Notes: Error bars represent the standard error of the mean (SEM).
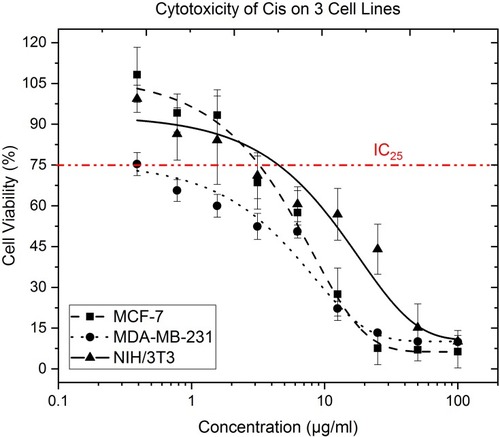
Table 2 Radiobiological Analysis Based on Linear Quadratic Models Corresponding to
Figure 5 Survival curves of control, BiONPs, Cis, and BC treated on (A) MCF-7, (B) MDA-MB-231 and (C) NIH/3T3 cells irradiated with HDR brachytherapy. The survival data were fitted to linear-quadratic (LQ) models.
Notes: Error bars represent the standards errors of survival fractions.
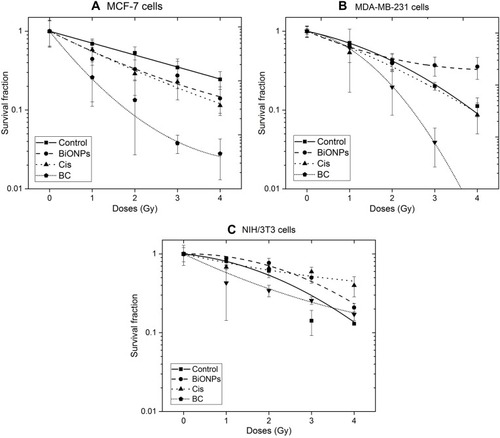
Figure 6 Comparison of theoretical DEF and experimental SER in MCF-7, MDA-MB-231, and NIH/3T3 cells.
Note: Theoretical DEF values are obtained from .
Abbreviations: DEF, dose enhancement ratio; SER, sensitization enhancement ratio; BiONPs, bismuth oxide nanoparticles; Cis, cisplatin; BC, BiONPs-Cis combination.
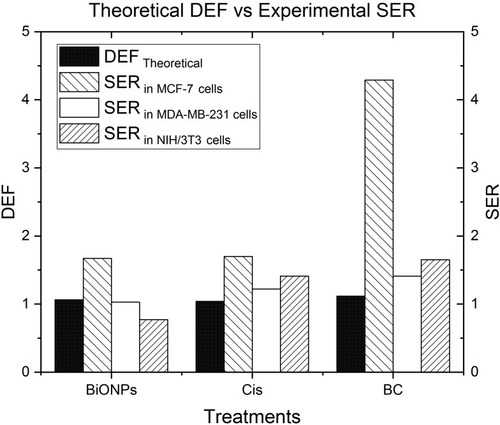
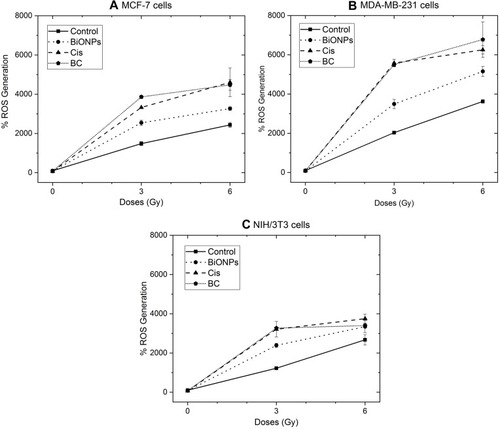
Figure 7 Reactive oxygen species (ROS) generation on (A) MCF-7, (B) MDA-MB-231 and (C) NIH/3T3 cells that underwent brachytherapy irradiation in the presence of BiONPs, Cis, and BC.
Notes: Error bars represent the errors of survival fractions.