Figures & data
Figure 1 (A) Microscopy photographs of Du145 cells showing development of red fluorescent spots originating from QD655 with simultaneous photobleaching of actin-GFP during illumination with the microscope excitation light (450–480 nm). Scale bar corresponds to 10 μm. (B) Pixel intensity kinetics of the QD fluorescence increase and actin-GFP photobleaching.
Abbreviations: GFP, green fluorescent protein; QD, quantum dot.
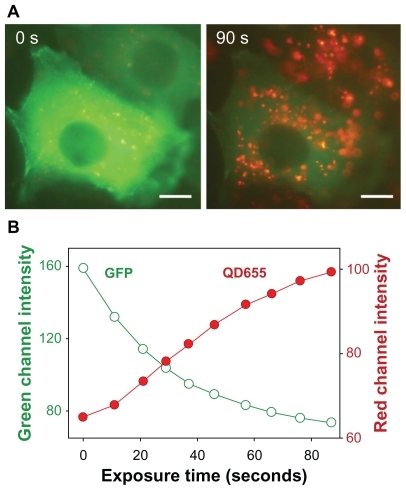
Figure 2 Size distribution chart of QD655 and lipodots measured using the DLS technique.
Abbreviations: QD, quantum dot; DLS, dynamic light scattering.
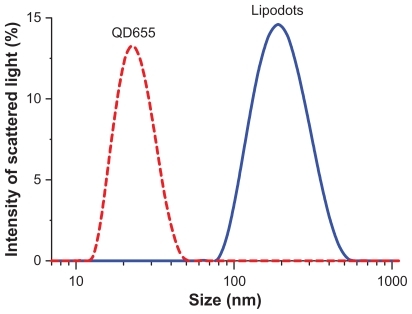
Figure 3 TEM images of the nanoparticles: (A) Empty liposomes as unilamellar and multilamellar vesicles of variable sizes (100–400 nm); (B) spherical to elongated QD655 from 6 to 12 nm in size; (C1) common view of the lipodots; (C2–C5) Magnified images of the lipodots of similar magnification.
Abbreviation: TEM, transmission electron microscope.
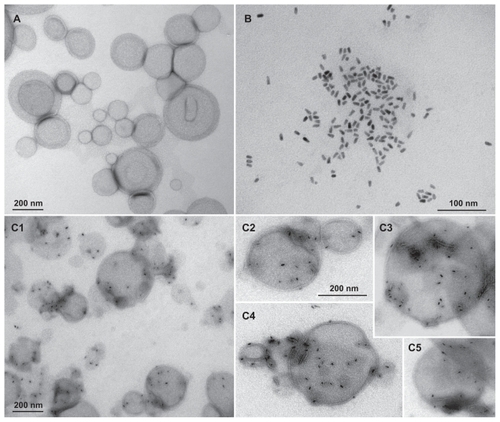
Figure 4 Oxidation kinetics of dihydrorhodamine123 by intact quantum dots QD655, lipodots, and in a mixture with empty liposomes (liposomes + QD655 incubated for 0 or 20 hours) during irradiation with 630 nm light.
Abbreviations: QD, quantum dot; DHR, dihydrorhodamine.
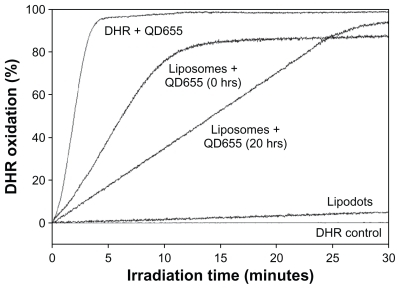
Figure 5 Comparative analysis of fluorescence decay of QD655 in aerated solution and in the absence or presence of oxygen in the solution. Distilled water was bubbled either with oxygen or argon gas for 15 minutes prior to the addition of the QDs. Oxygen was also removed by adding sodium sulfite to the QD solution. Each curve is an average of three separate measurements. The inserts show oxygen concentrations in water during bubbling with pure oxygen or argon and after adding sodium sulfite.
Abbreviations: QD, quantum dot; IRF, infrared fluorescence.
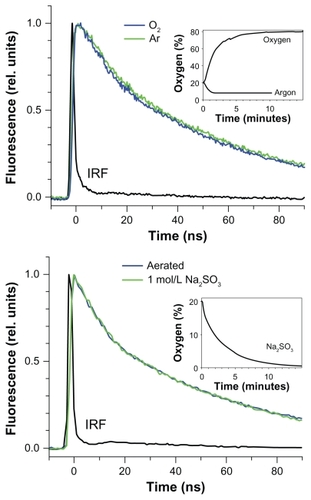
Figure 6 (A) Fluorescence spectra of QD655 in PBS and lipodots. (B) Fluorescence decay of QD655 in different solutions. Fluorescence intensity is normalized to 1 at initial values.
Abbreviations: QD, quantum dot; PBS, phosphate buffered saline.
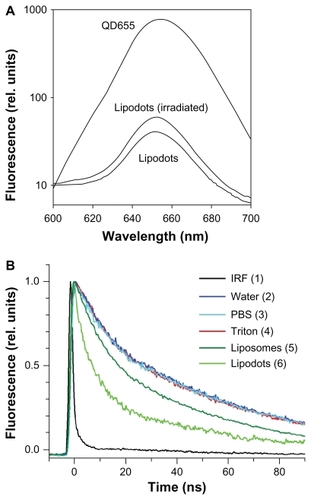
Figure 7 The effect of irradiation with red or blue light on fluorescence decay of lipodots. The fluorescence decay of QD655 is shown for comparison (curve 2). The same sample of lipodots was irradiated for 15 minutes (curve 4) and then for an additional 15 minutes (curve 5) for a total of 30 minutes either with the red or blue light. The curves are averages of three separate measurements. The fluorescence decay of the irradiated lipodots remained unchanged when measured 24 hours after the irradiation. See supporting material for calculated fluorescence decay times.
Abbreviations: IRF, infrared fluorescence; PBS, phosphate buffered saline.
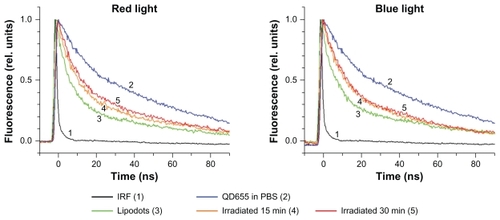
Figure 8 Fluorescence decay of intact QD655 in suspension of empty liposomes and of QD655 encapsulated in liposomes (lipodots). Fluorescence decay was measured immediately after addition of QD655 to the suspension of empty liposomes or the preparation of lipodots (0 hours, curve 2) and then after 20 hours storage at room temperature of the QD655 mixture with liposomes (curve 3). Further, the samples were irradiated with the blue light for 30 minutes, and their fluorescence decays were measured (curve 4). Lipodots were irradiated soon after sample preparation, while the QD655 mixture with empty liposomes was kept 20 hours prior to the irradiation. Finally, after the irradiation, both samples were kept for 20 hours at room temperature, and their fluorescence decay was measured again (curve 5).
Abbreviation: QD, quantum dots.
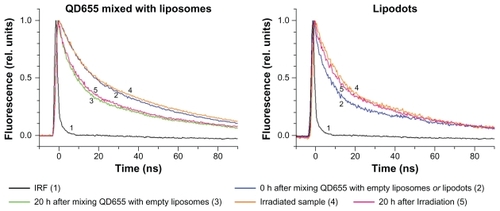
Table 1 Fluorescence lifetimes of QD655 in different solutions and the fluorescence lifetimes of lipodots before and after irradiation with the blue light
Figure 9 The effect of storage time and irradiation on the fluorescence decay of QD655 in (A) PBS and (B) 1% BSA in PBS. The fluorescence lifetime of QD655 was measured immediately after addition of the QDs to the solutions (0 h, curve 2) and then after the samples had been stored for 20 hours at room temperature in darkness (curve 3). The samples were irradiated with the blue light lamp for 3 hours, and their fluorescence lifetimes were measured (curve 4). Finally, the irradiated samples were stored for an additional 20 hours at room temperature in darkness, and fluorescence decay was measured again (curve 5).
Abbreviations: BSA, bovine serum albumin; PBS, phosphate buffered saline.
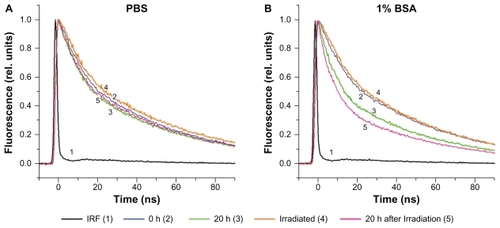
Figure 10 QD655 stability in different solvents: distilled water (A), PBS (B), and 1% BSA in PBS (C) at different temperatures. The dashed line (------) represents samples kept at room temperature (22°C) after being heated up to the highest temperature (65°C) to monitor possible recovery of fluorescence. The intensity kinetics were calculated as a percentage relative to the initial fluorescence intensity. Each data point represents an average of three independent samples with standard deviation.
Abbreviations: BSA, bovine serum albumin; PBS, phosphate buffered saline; QD, quantum dot.
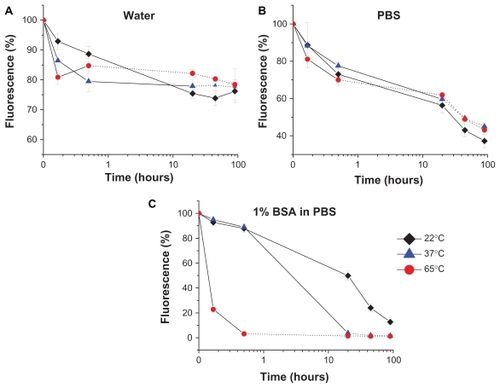
Figure 11 Fluorescence recovery of QD655 after irradiation with blue light. The samples of 10 nmol/L QD655 in different solvents (distilled water, PBS, and 1% BSA in PBS) were kept for 20 hours at 37°C and then for an additional 25 hours at room temperature (22°C) prior to the irradiation. The samples were irradiated with the blue light lamp. The intensity kinetics were calculated as a percentage relative to the initial fluorescence intensity. Each data point represents an average of three independent samples with standard deviation. The horizontal lines represent fluorescence of the samples 42 hours after the end of the irradiation.
Abbreviations: BSA, bovine serum albumin; PBS, phosphate buffered saline; QD, quantum dot.
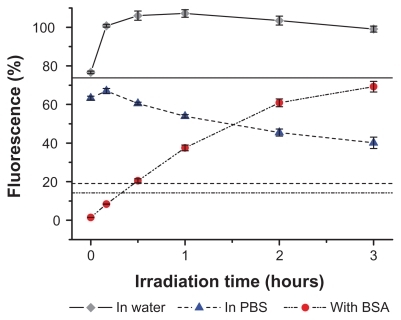
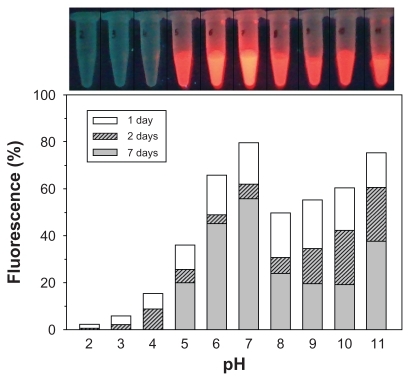
Figure 12 Stability of QD655 fluorescence at different pH under storage for several days. Fluorescence intensity measured immediately after sample preparation corresponds to 100%.