Figures & data
Figure 1 The cell viability of Cur and Gal-BSA-Cur NPs on Caco-2 cells.
Notes: Each point represents the mean ± standard deviation (n=6). **P < 0.01, ***P< 0.001, compared to Gal-BSA-Cur NPs.
Abbreviations: Cur, curcumin; Gal-BSA-Cur NPs, curcumin-loaded galactosylated BSA nanoparticles.
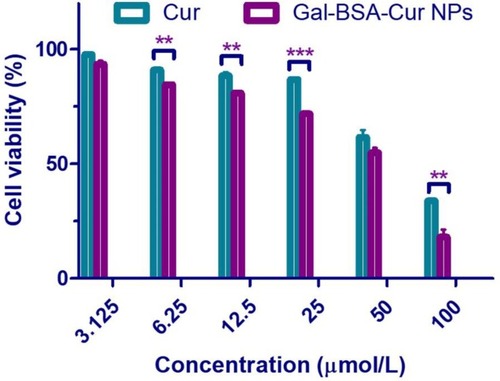
Figure 2 Fluorescence microscopy images of cells incubated with 25 μmol/L of Cur and Gal-BSA-Cur NPs for 4 hrs.
Notes: Scale bar: 50μm, Magnification ×400. DAPI: cell nuclei (blue), merged: fluorescence overlaid image.
Abbreviations: Cur, curcumin; Gal-BSA-Cur NPs, curcumin-loaded galactosylated BSA nanoparticles.
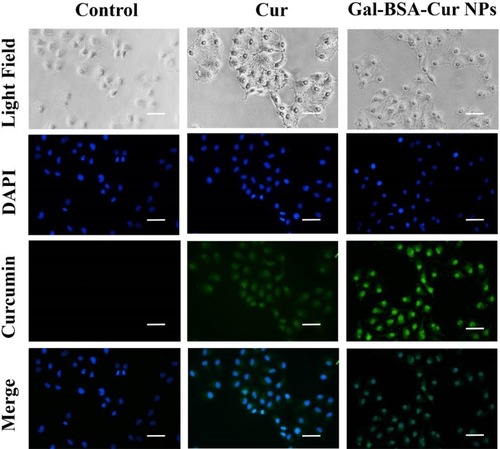
Figure 3 The quantitative assay of cellular uptake of Cur and Gal-BSA-Cur NPs in Caco-2 cells using HPLC.
Notes: The curcumin concentration was detected by HPLC. ***P <0.001 compared with Gal-BSA-Cur NPs. The results were expressed as the mean ± standard deviation (n=3).
Abbreviations: Cur, curcumin; Gal-BSA-Cur NPs, curcumin-loaded galactosylated BSA nanoparticles; HPLC, high-performance liquid chromatography.
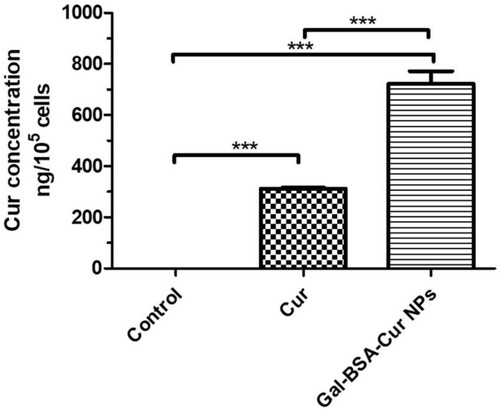
Figure 4 Intracellular uptake of Cur and Gal-BSA-Cur NPs in Caco-2 cells pretreated with different inhibitors.
Notes: ***P <0.001 compared with Cur or Gal-BSA-Cur NPs. **P <0.01, compared to the pretreatment with sodium azide or sucrose. The results were expressed as the mean ± standard deviation (n=3).
Abbreviations: Cur, curcumin; Gal-BSA-Cur NPs, curcumin-loaded galactosylated BSA nanoparticles.
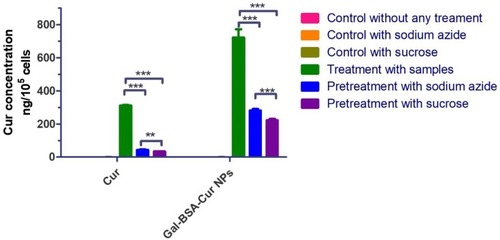
Figure 5 Scheme of the absorption mechanism used by Cur or Gal-BSA-Cur NPs.
Abbreviations: Cur, curcumin; Gal-BSA-Cur NPs, curcumin-loaded galactosylated BSA nanoparticles.
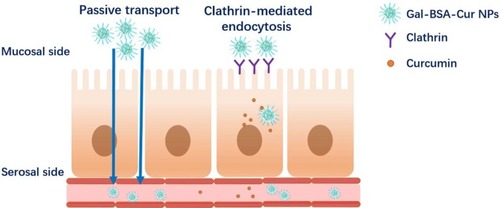
Figure 6 In vitro the Ussing chamber cumulative absorption of Cur and Gal-BSA-Cur NPs in rat jejunums (n=3).
Abbreviations: Cur, curcumin; Gal-BSA-Cur NPs, curcumin-loaded galactosylated BSA nanoparticles.
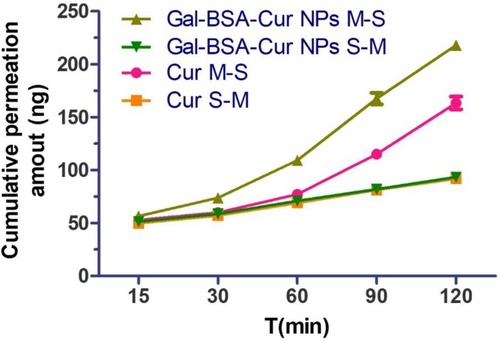
Table 1 The Apparent Permeability Values (papp) of Cur and Gal-BSA-Cur NPs Determined from Ussing Chamber Assay in Mucosal-to-Serosal (M-S) and Serosal-to-Mucosal (S-M)
Table 2 Pharmacokinetic Parameters of Cur and Gal-BSA-Cur NPs
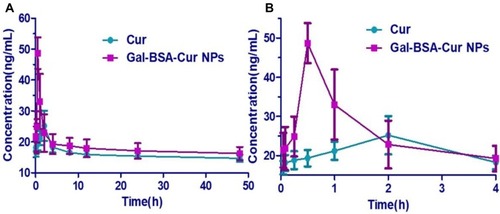
Figure 7 The plasma concentrations versus time curves of Cur and Gal-BSA-Cur NPs after oral administration in rats. (A) The time from 0 to 48 hrs. (B) The time from 0 to 4 hrs.
Notes: Rats were treated with Cur (40 mg/kg) or Gal-BSA-Cur NPs (equivalent to the Cur). Data were represented as mean ± SD (n=6).
Abbreviations: Cur, curcumin; Gal-BSA-Cur NPs, curcumin-loaded galactosylated BSA nanoparticles.