Figures & data
Figure 1 (A) The SEM images of (i) CG, (ii) CG-Ag and (iii) CG-Ag-Q; (B) The secondary electron (SE) image (i) coupled with the BSE image (ii) and the EDX spot analysis of the CG-Ag samples; (C) The release profile of (i) Ag and (ii) quercetin from the CG-Ag-Q (data = mean ± standard error of means; n = 6).
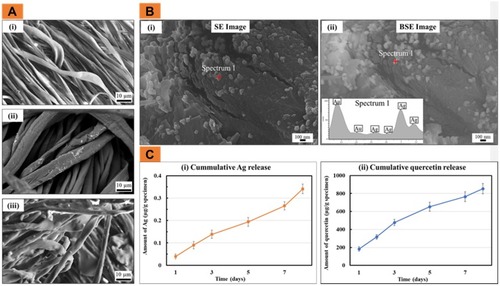
Figure 2 (A) Dose-dependent antimicrobial activity of quercetin against S. aureus; (B) Antimicrobial activity of Ag and quercetin when used in combination (data = mean ± standard error of means; n = 3); and (C) Antioxidant activity of the CG-Ag-Q (data = mean ± standard error of means; n = 3).
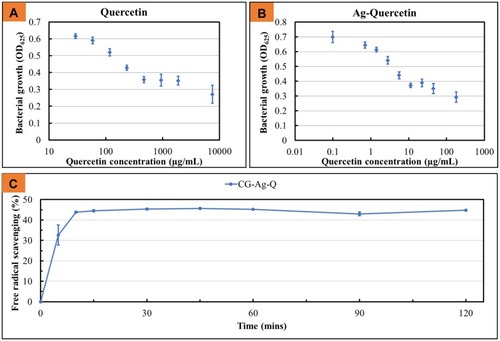
Figure 3 CG-Ag-Q dressing accelerated wound closure. (A) Photographs showing wound sites at 0 and 7, 10 and 12 days post-surgery; (B) Wound closure (indicated by wound area as % of area at day 0) at 7, 10 and 12 days post-surgery (data = mean ± standard error of means, n=2 biological repeats).
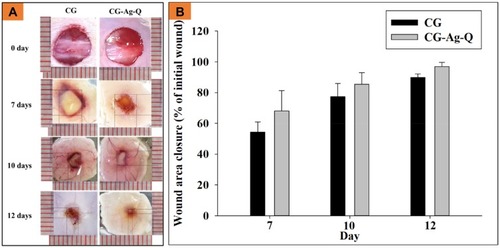
Figure 4 The H&E staining of the skin tissues at days 7, 10, and 12 post-surgery for the CG-control group. Scale bars are 100 µm. A, B, C show the staining sections at day 7, 10 12, respectively. (A1–C1) were from the areas near the wound edge and (A2–C2) were from the areas near the middle of the wounds.
Abbreviations: EL, Epidermis; DL, dermis; S, scab; IC, inflammation-mediating cells; NA, neo-angiogenesis; SG, sebaceous glands.
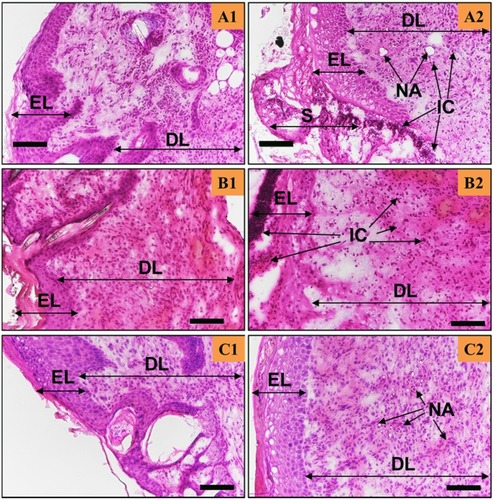
Figure 5 The Ag-Q coating improved tissue remodelling, neo-angiogenesis, and reduced inflammation. H&E staining of the skin tissues at days 7, 10, and 12 post-surgery for the CG-Ag-Q group. (A1–C1) were from the areas near the wound edge and (A2–C2) were from the areas near the middle of the wounds. Scale bars are 100 µm.
Abbreviations: EL, Epidermis; DL, dermis; S, scab; IC, inflammation-mediating cells; NA, neo-angiogenesis; HF, hair follicles; SG, sebaceous glands; A, adipocytes.
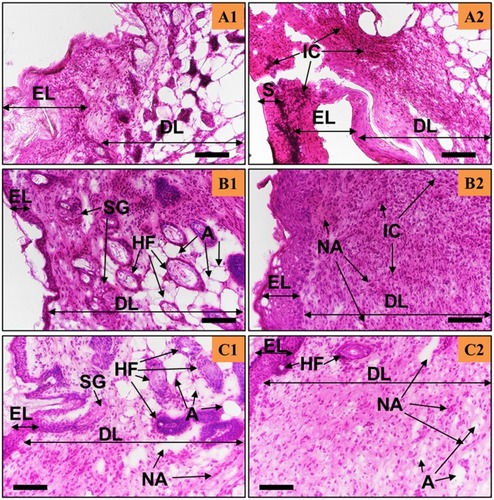
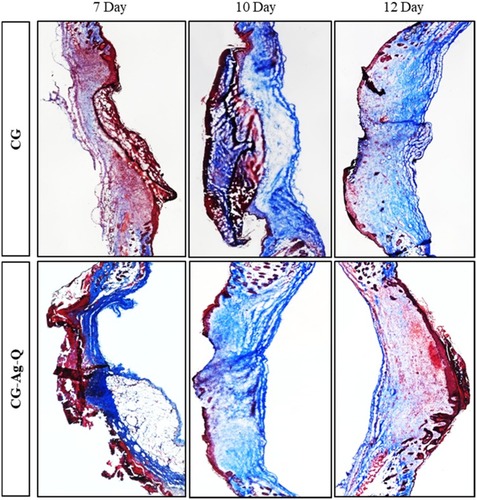
Figure 6 MT staining images of the skin tissues at days 7, 10, and 12 post-surgery in the CG and CG-Ag-Q groups.