
Figures & data
Figure 1 Inverted light micrographs of Nostoc Bahar M strain.
Notes: (A) Barrel-shaped Nostoc trichomes. (B) Coccoid cells (arrow) surrounded by a sheath.
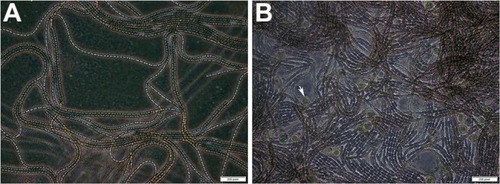
Figure 2 Electrophoresis of the extracted genomic DNA in a 1% agarose gel.
Notes: (A) 16S rDNA amplified by PCR from genomic DNA of Nostoc. (M) Molecular marker 1500 bp.
Abbreviation: PCR, polymerase chain reaction.
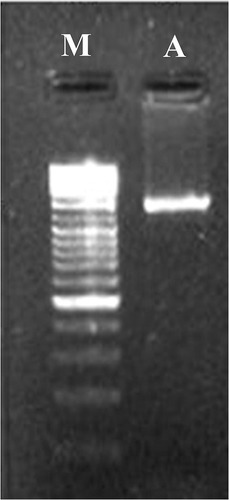
Figure 3 The phylogenetic tree of Nostoc sp. based on partial sequencing of 16S rRNA.
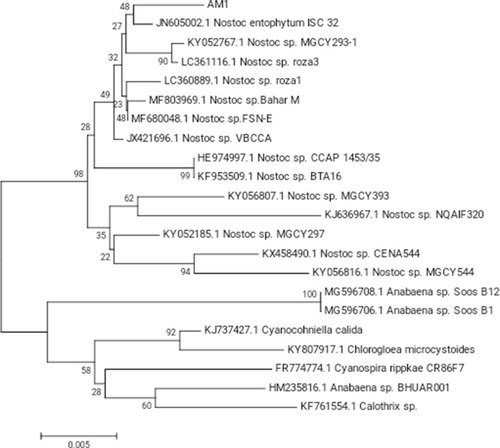
Figure 4 UV-vis absorption spectra of biogenic SNPs synthesized by Nostoc sp.
Note: The plasmon resonance of SNPs at 403 nm.
Abbreviations: UV-vis, ultraviolet-visible; SNPs, silver nanoparticles.
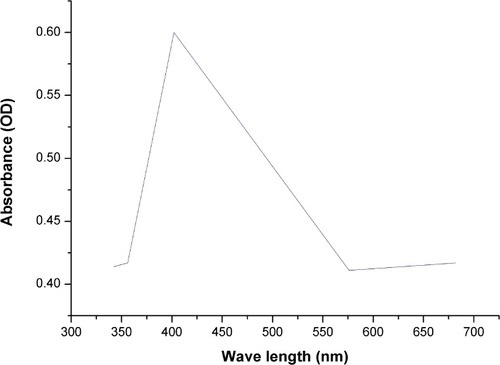
Figure 5 XRD pattern of biogenic SNPs synthesized by Nostoc sp.
Note: Four peaks at 3.5 KeV ranging from 0° to 80° at 2ϴ values for SNPs.
Abbreviations: XRD, x-ray diffraction; SNPs, silver nanoparticles.
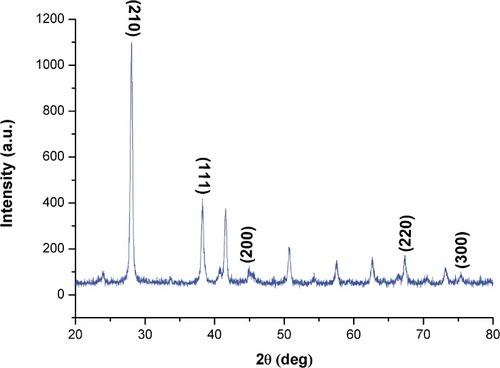
Figure 6 FTIR spectra of biogenic SNPs.
Abbreviations: FTIR, Fourier-transform infrared; SNPs, silver nanoparticles.
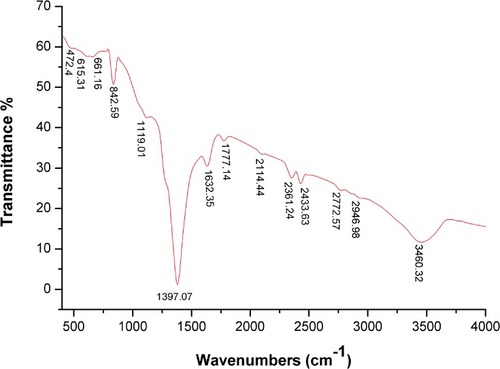
Figure 7 SEM examination of SNPs.
Notes: SEM image showing the spherical shape of SNPs, with some SNPs aggregations. Scale bar, 0.2 µm.
Abbreviations: SEM, scanning electron microscope; SNPs, silver nanoparticles.
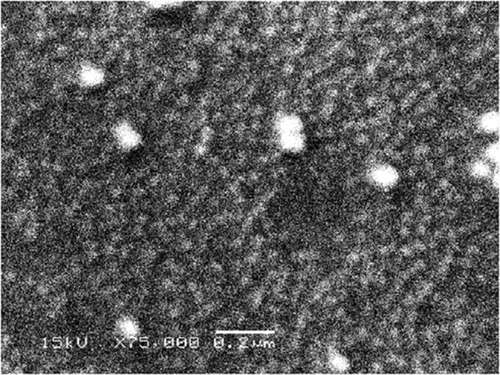
Figure 8 TEM examination and size distribution of SNPs.
Notes: (A) TEM micrograph exhibiting the spherical shape of SNPs with size range of 8.5 to 26.44 nm. Scale bar, 50 nm. (B) SNPs size distribution from TEM analysis, with average size of 14.9 nm.
Abbreviations: TEM, transmission electron microscope; SNPs, silver nanoparticles.
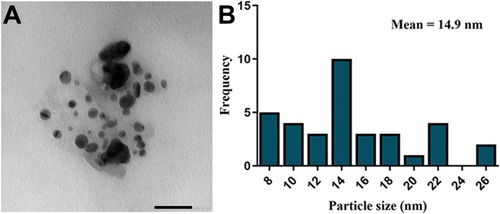
Figure 9 Dose-dependent growth inhibition of Caco-2 cells by SNPs.
Notes: (A) Antiproliferative effect of SNPs synthesized by Nostoc sp. against Caco-2 cell line expressed as percentage cell viability. (B) Caco-2 cell viability percentage and the log concentration at which cell viability is reduced to 50%. Data from at least three independent experiments performed in at least triplicate are presented as mean ± SD; P value was calculated versus control cells: *P < 0.05; **P < 0.01 and ****P < 0.001.
Abbreviations: SNPs, silver nanoparticles; SD, standard deviation.
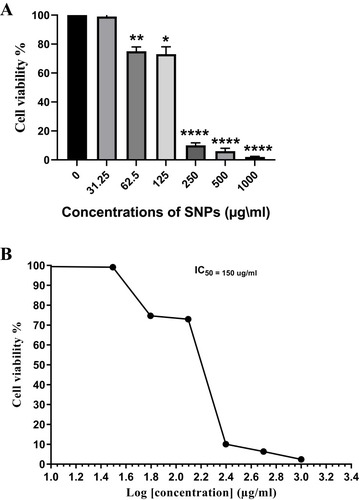
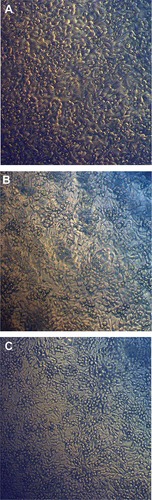
Figure 10 Inverted light micrographs of Caco-2 cells.
Notes: Morphological changes in Caco-2 cells before and after being treated with SNPs. (A) Control, (B) Caco-2 cells treated with IC25 SNPs (75 µg/mL), (C) Caco-2 cells treated with IC50 SNPs (150 µg/mL).
Abbreviation: SNPs, silver nanoparticles.
Data Availability
The data supporting this article are available in –. The data sets analyzed in the present study are available from the corresponding author on reasonable request.