Figures & data
Figure 1 Identification of the RGD.Ad-ING4-IL-24 vector. (A) Gel electrophoresis of homologous recombinant adenovirus clones: Line 1, pAdTrack-CMV-ING4-polyA+promoter-IL-24 plasmid; Line 2, pAdEasy-1 adenoviral backbone plasmid; Line 3~8, the 6 selected clones. (B) Gel electrophoresis of genes ING4, IL-24 and poly+promoter amplified by PCR: Line 1, ING4 cDNA fragments amplified by PCR; Line 2, negative control group compared to ING4 cDNA fragments amplified by PCR; Line 3, polyA+promoter cDNA fragments amplified by PCR; Line 4, negative control group compared to polyA+promoter cDNA fragments amplified by PCR; Line 5, IL-24 cDNA fragments amplified by PCR; Line 6, negative control group compared to IL-24 cDNA fragments amplified by PCR; M, DL2000 marker. (C) The ING4 expression in QBI-293A cells analyzed by Western blotting. (D) The IL-24 secretion from QBI-293A cells detected by ELISA. Statistically significant in comparison with PBS, *p<0.05.
Abbreviations: RGD, Arg-Gly-Asp; Ad, adenovirus; ING4, inhibitor of growth 4; IL-24, interleukin-24; CMV, cytomegalovirus; PCR, polymerase chain reaction; ELISA, enzyme-linked immunosorbent assay.
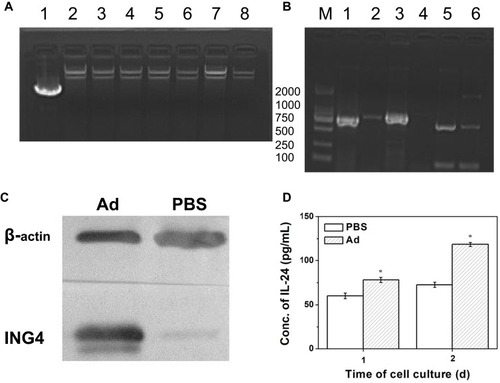
Figure 2 Synthesis and characteristics of CASF. (A) Schematic diagram of CASF synthesis. (B) Zeta potential of CASF at PEI/ASF weight ratios of 0%, 0.1%, 0.5%, 1%, 2%, 4%, 6% and 8%. (C) 1H-NMR spectra of PEI, ASF and CASF in D2O.
Abbreviations: CASF, cationic Antheraea pernyi silk fibroin; PEI, polyethylenimine; ASF, Antheraea pernyi silk fibroin; NMR, nuclear magnetic resonance.
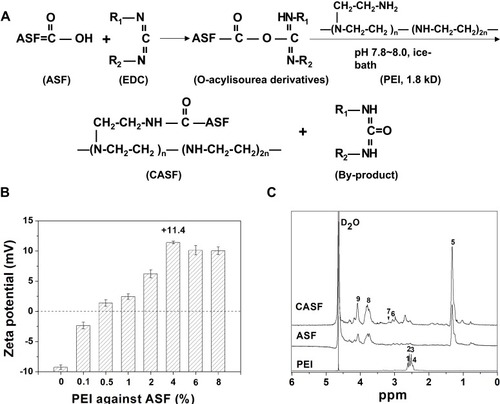
Figure 3 The laser confocal fluorescence images of SMMC-7721 and L-02 cells infected with Ad at MOIs of 0, 5, 10, 20, 50, 100, 150 and 200, respectively. (A) Fluorescence field and (B) bright-field images of SMMC-7721 cells; (C) fluorescence field and (D) bright-field images of L-02 cells. Scale bar: 100 μm.
Abbreviations: Ad, adenovirus; MOI, multiplicity of infection.
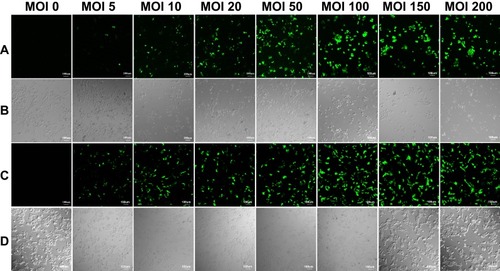
Figure 4 Preparation schematic diagram and stability of the CASF/Ad complex. (A) Schematic diagram of the preparation of CASF/Ad complex. (B) Scanning electron microscopy images, (C) particle diameter and (D) zeta potential of the CASF/Ad complex formed by coating Ad with CASF at a concentration of 50 μg/mL at 0 h, 4 h, 8 h, 12 h, 24 h, 48 h and 72 h after the preparation. Scale bar: 2.00 μm.
Abbreviations: CASF, cationic Antheraea pernyi silk fibroin; Ad, adenovirus.
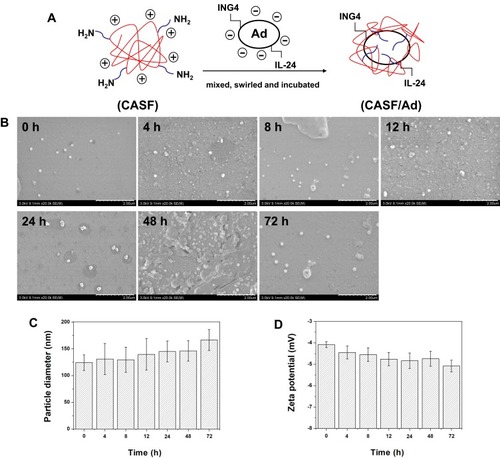
Figure 5 Characteristics of the CASF/Ad complex. (A) Scanning electron microscopy images, (B) particle diameter and (C) zeta potential of the Ad and the CASF/Ad complex. Scale bar: 2.00 μm. CASF 10 to CASF 150 represented the CASF/Ad complexes were formed by coating Ad with CASF at concentrations of 10, 50, 100 and 150 μg/mL, respectively.
Abbreviations: CASF, cationic Antheraea pernyi silk fibroin; Ad, adenovirus.
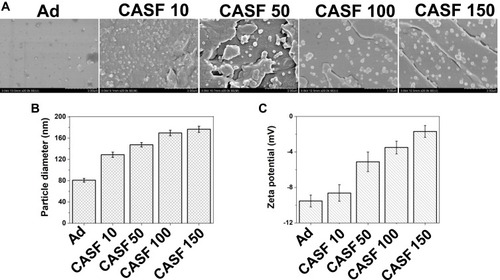
Figure 6 The laser confocal fluorescence images of SMMC-7721 and L-02 cells cultured with DMEM, Ad and CASF/Ad complex for 24 h. (A) Fluorescence field and (B) bright-field images of SMMC-7721 cells; (C) fluorescence field and (D) bright-field images of L-02 cells. Scale bar: 100 μm. CASF 10 to CASF 150 represented cells were infected with the CASF/Ad complexes formed by coating Ad with CASF at concentrations of 10, 50, 100 and 150 μg/mL, respectively.
Abbreviations: DMEM, Dulbecco’s modified Eagle medium; CASF, cationic Antheraea pernyi silk fibroin; Ad, adenovirus.
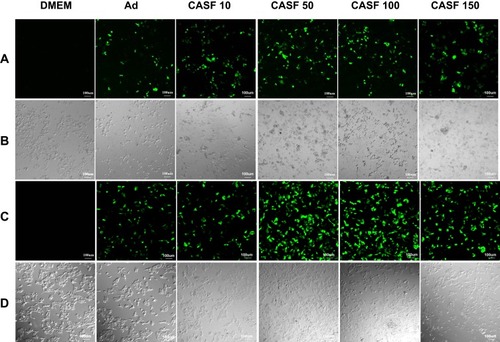
Figure 7 The infection efficiency of cells infected with Ad and CASF/Ad complex for 24 h. The flow cytometry images of (A) SMMC-7721 and (B) L-02 cells, and the corresponding histogram of infection efficiency of (C) SMMC-7721 and (D) L-02 cells. CASF 10 to CASF 150 represented cells were infected with the CASF/Ad complexes formed by coating Ad with CASF at concentrations of 10, 50, 100 and 150 μg/mL, respectively. Statistically significant in comparison with naked Ad, **p<0.01.
Abbreviations: CASF, cationic Antheraea pernyi silk fibroin; Ad, adenovirus.
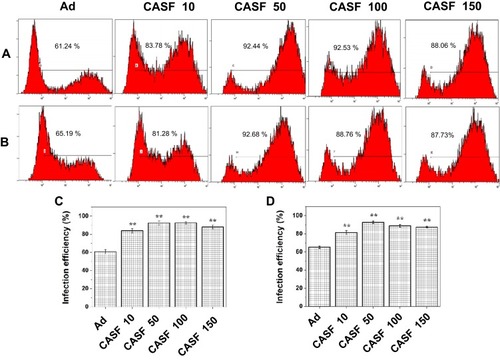
Figure 8 Target gene expression and cell apoptosis. SMMC-7721 cells were cultured with DMEM, Ad and CASF/Ad complex for 48 h. (A) The ING4 expression in SMMC-7721 cells analyzed by Western blotting. (B) The IL-24 secretion from SMMC-7721 cells detected by ELISA. (C) The flow cytometry images and (D) the corresponding histogram of apoptosis rates of SMMC-7721 cells. Statistically significant in comparison of CASF/Ad with Ad, DMEM and Ad with DMEM, *p<0.05, **p<0.01.
Abbreviations: DMEM, Dulbecco’s modified Eagle medium; Ad, adenovirus; CASF, cationic Antheraea pernyi silk fibroin; ING4, inhibitor of growth 4; IL-24, interleukin-24; ELISA, enzyme-linked immunosorbent assay.
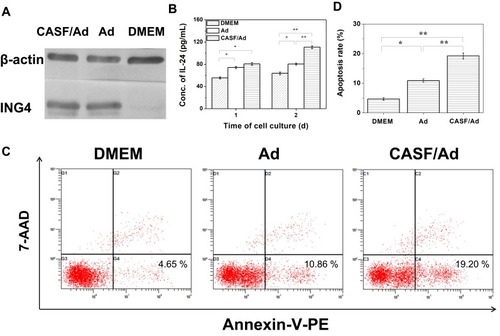
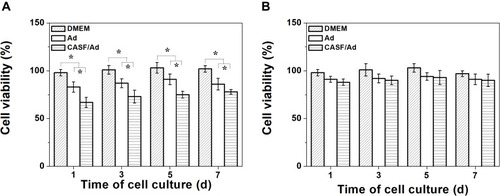
Figure 9 Proliferation of SMMC-7721 and L-02 cells. The cell viability of (A) SMMC-7721 and (B) L-02 cells cultured with DMEM, Ad and CASF/Ad complex for 1, 3, 5 and 7 days. Statistically significant in comparison of CASF/Ad with Ad, DMEM and Ad with DMEM, *p<0.05.
Abbreviations: DMEM, Dulbecco’s modified Eagle medium; Ad, adenovirus; CASF, cationic Antheraea pernyi silk fibroin.