Figures & data
Table 1 Characterization of Synthesized Nanocapsules
Figure 1 Pharmacokinetic profiles of fluorescently labeled polyelectrolyte nanocapsules in serum after intravenous administration.
Notes: NC-PGA-RhB or NC-PEG-RhB nanocapsules were injected intravenously. Fluorescence was measured in sera obtained at different time points after administration, and the value corresponding to serum autofluorescence was subtracted. Each point in the graph represents the mean ± SD (n=6).
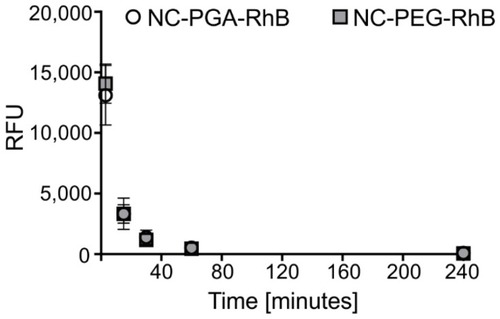
Figure 2 Pharmacokinetic profiles of fluorescently labeled polyelectrolyte nanocapsules in the liver, spleen, and kidneys after intravenous administration. NC-PGA-RhB and NC-PEG-RhB were injected intravenously.
Notes: Fluorescence was measured in organs' homogenates obtained at different time points after administration, and autofluorescence corresponding to control homogenates was subtracted. Each point in the graphs represents the mean ± SD (n=5).
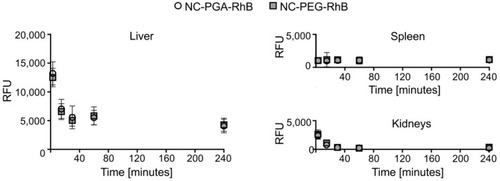
Figure 3 Biodistribution of fluorescently labeled polyelectrolyte nanocapsules after 24 hrs exposure.
Notes: NC-PGA-RhB and NC-PEG-RhB or 15 mM NaCl were injected intravenously. Animals were placed in metabolic cages in purpose of collecting urine and feces. After 24 hrs mice were sacrificed, and fluorescence was measured in serum, homogenates of major organs, and bile. Results are presented as the percent of the detected dose (see Methods). Fluorescence of 24-hrs total urine and feces is presented. UD, under detection limit. Bars represent mean ± SD (n=5).
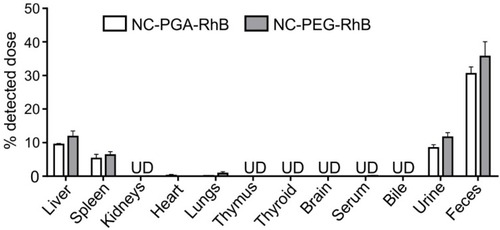
Figure 4 Analysis of hematotoxicity of polyelectrolyte nanocapsules after repeated intravenous administration.
Notes: Mice were injected intravenously with 8 doses of 15 mM NaCl, NC-PGA or NC-PEG. Animals were euthanized on 30th or 60th day of the experiment, blood samples were collected from the facial vein and main hematological parameters were analyzed. Each point in graphs represents an individual mouse. The line for each group represents the mean ± SD (n=6).
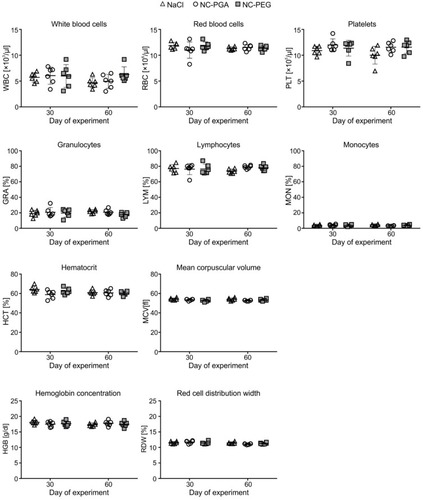
Figure 5 Comet assay of DNA damage after exposure of animals to 8 doses of polyelectrolyte nanocapsules.
Notes: Bone marrow and peritoneal cells were collected on 30th or 60th day of the experiment. Each point in graphs represents an individual mouse. The line for each group represents the mean ± SD (n=6). The percentage of DNA in the comet tail (% DNA damage) was determined from two slides per sample with 50 randomly selected cells per slide.
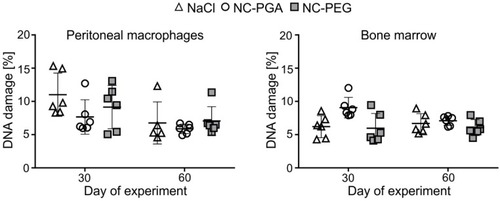
Figure 6 Biochemical analyses of sera isolated from animals after repeated administration of polyelectrolyte nanocapsules.
Notes: Animals were euthanized on the 30th or 60th day of the experiment, blood was isolated by cardiac puncture, and biochemical markers of hepatotoxicity and nephrotoxicity were analyzed in sera. Each point in graphs represents an individual mouse. The line for each group represents the mean ± SD (n=6).
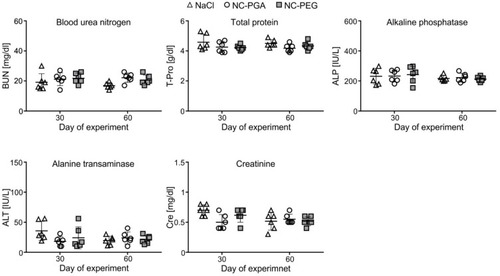
Figure 7 Histological examination of the liver, kidney and spleen isolated from animals after repeated administration of polyelectrolyte nanocapsules.
Notes: Analysis was performed on (A) 30th or (B) 60th day of experiment.
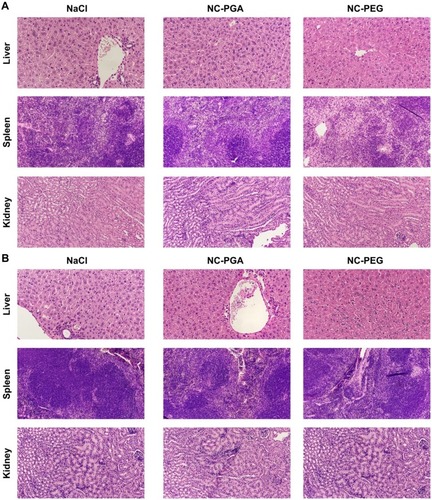
Figure 8 Analysis of cytokine concentrations in mice sera after repeated administration of polyelectrolyte nanocapsules.
Notes: Cytokine concentrations in sera collected on (A) 30th or (B) 60th day of experiment were determined using LEGENDplex Mouse inflammation Panel kit and the BD LSRFortessa flow cytometer. Control level corresponds to cytokine concentrations in sera from mice injected with 15 mM NaCl. Bars represent mean ± SD (n=5). Statistical significance was analyzed by multiple-t-test.
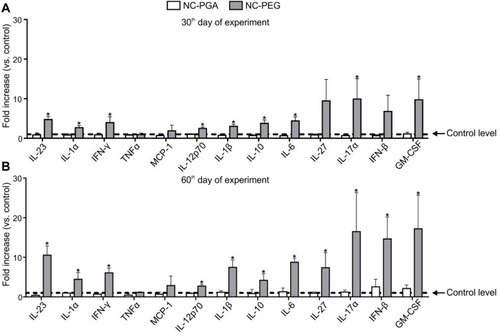
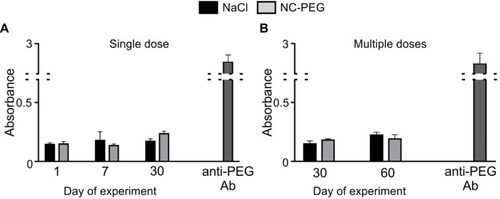
Figure 9 ELISA for analysis of humoral response to nanocapsules. ELISA plates were coated with PGA-g-PEG.
Notes: The presence of anti-PEG antibody in sera from mice injected with 15 mM NaCl or NC-PEG in: (A) the single dose- or (B) multiple doses scheme (see Methods) was probed with HRP-conjugated anti-mouse Ig. To prove proper coating of plates with the antigen, commercial anti-PEG Ab was used as a positive control. Bars represent mean ± SD (n=5).