Figures & data
Table 1 List of Primers Used for Real-Time RT-PCR
Figure 1 The characterization of the La2O3 NPs and La2O3 MPs. (A) The SEM images of La2O3 NPs (a) and La2O3 MPs (b) at high magnification, and the particles were in irregular sheet structure. Scale bar = 500 nm. (B) The TEM images of La2O3 NPs (a) and La2O3 MPs (b) at high magnification, showing aciniform aggregates and agglomerates in Figure 1Ba, and the average sizes of La2O3 NPs and La2O3 MPs in (c). (d) and (e): La2O3 NPs and La2O3 MPs bioaccumulate in scrotal tissues by TEM analysis. Scale bar = 1 μm. (C) The XRD patterns of the La2O3 NPs (a) and La2O3 MPs (b).
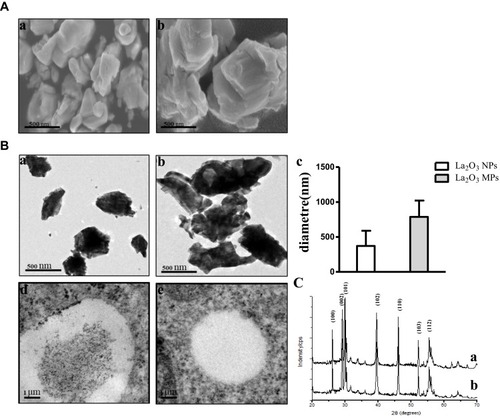
Table 2 Characteristics of La2O3 NPs in the Different pH Values Solutions
Figure 2 Effects of La2O3 NPs on mouse growth and testicular histology. (A) The body weights of mice in the 5 groups were compared, and the differences were not statistically significant (Figure 2A) (P > 0.05). (B) Histopathological changes in murine testes caused by intragastric administration of La2O3 NPs for 90 days. The testes from control (a), NL (b) and WM (e) groups showed normal morphology and spermatogenesis. In the NM and NH (c and d) groups, the testes exhibited vacuole-like changes in the spermatogenic epithelium, as indicated by arrows (×400). Moreover, moderate LCs edema (asterisk) were observed in NM and NH groups.
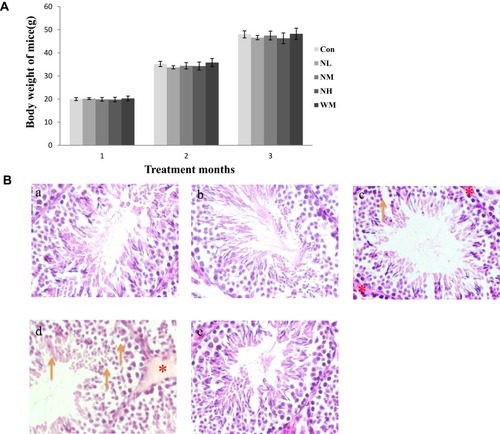
Table 3 Effects of Different Doses of La2O3 NPs and MPs on Coefficients of Mice
Table 4 The La Contents in Whole Blood and Different Organs
Figure 3 La2O3 NPs and MPs influence on ultrastructure of testis. (A) Control. (B) La2O3 NPs (5 mg/kg). (C) La2O3 NPs (10 mg/kg). Arrows indicate mitochondria and vacuoles in mitochondria. (D) La2O3 NPs (50 mg/kg). (E) La2O3 MPs (50 mg/kg) (×8000). The control and La2O3 MPs groups showed no morphological changes, but vacuolar changes in the mitochondria were detected in the NM and NH groups (arrows). In affected tubules, vacuolation of the seminiferous epithelium could be detected (red asterisk).
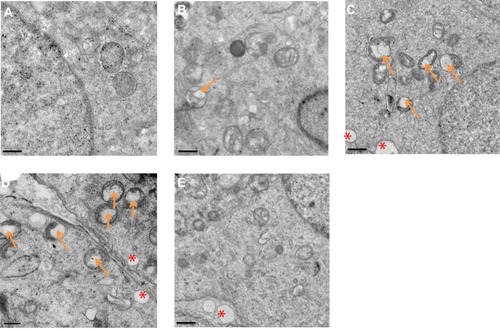
Figure 4 The impact of La2O3 NPs and MPs on sperm parameters, levels of testis testosterone, genes and proteins involved in synthesis of testosterone. Changes in sperm count (Aa) and sperm motility percentages (Ab) and sperm survival percentages (Ac) of the mice; (Ba) testis testosterone; (Bb) LH levels; (Bc) FSH levels; (Bd) GnRH levels in the 90 days intragastric exposures. (N=10, mean S.D.). *P <0.05 vs control group. Effects of La2O3 NPs and MPs on mRNA expression of StAR, CYP11A1, CYP17A1 and LHR in testes (Ca-d). Effects of La2O3 NPs and MPs on protein expression of StAR, CYP11A1, CYP17A1 and LHR (Da-b). β-Actin was used as the internal control. *P<0.05 vs control.
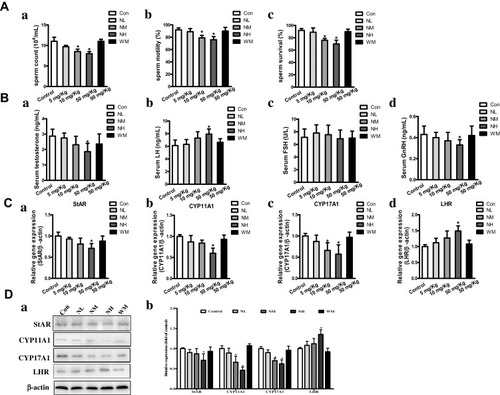
Figure 5 La2O3 NPs and MPs induced Nrf-2/ARE signaling changes in mice testes. (A) Effects of La2O3 NPs and MPs on MDA level, SOD and CAT activities. (a) SOD level. (b) MDA activity. (c) CAT activity. (B) La2O3 NPs and MPs infleuenced on Nrf-2/ARE signaling relative genes in mouse testes. Effects on mRNA expression levels of Keap-1, Nrf-2, NQO1, HO-1 and GSH-Px in mice testes. (Ca-Cb) The protein levels of Nrf-2/ARE signaling relative genes by western blotting.
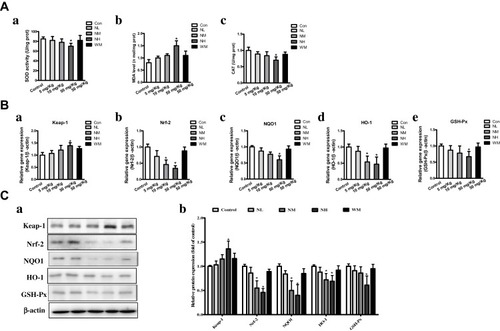
Figure 6 Effects of La2O3 NPs and MPs on testicular inflammation. (A) Inflammation testicular cells in the control group (a), NL group (b), NM group (c), NH group (d) and WM group (e). NF-κB-positive cells (f) were significantly increased in the NM and NH groups (×400, P<0.05). However, in the NL and WM groups no significant differences were found compared with control group (Figure 6A, P>0.05). The expressions of expression levels of inflammatory enzymes iNOS, IL-1β, TNF-α and COX-2 were elevated in NM and NH groups (P<0.05) (Ba-d). Furthermore, the expressions of TNF-α, IL-1β, iNOS and COX-2 were validated by Western-blot analysis shown in (Ca-b), and the expressions of iNOS, IL-1β, TNF-α and COX-2 in NH group were increased by 1.72-, 1.62-, 1.68- and 1.57-fold, respectively (P<0.05).
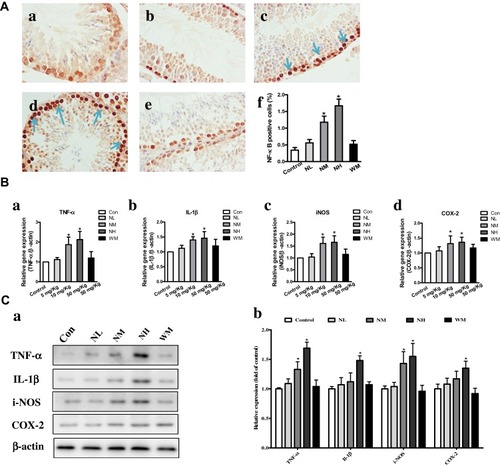
Figure 7 Effects of La2O3 NPs and MPs on testicular cells apoptosis. TUNEL and immunohistochemical staining of BAX (A-B) was detected at × 400 magnification. Apoptotic testicular cells in the control group (a), NL group (b), NM group (c), NH group (d) and WM group (e). Arrows indicated the positive cells, and histograms showing the percentages of TUNEL and BAX-positive cells (f). Exposure of mice to La2O3 NPs and MPs down-regulated of Bcl-2, and up-regulated both in the gene and protein levels of BAX in NH group compared with control group (Figure 7C-D) (P<0.05). The results of Bcl-2 and BAX protein expression in mouse testicular tissue were determined by Western blotting. β-Actin was used as the internal control (Da-b). *P< 0.05 vs control.
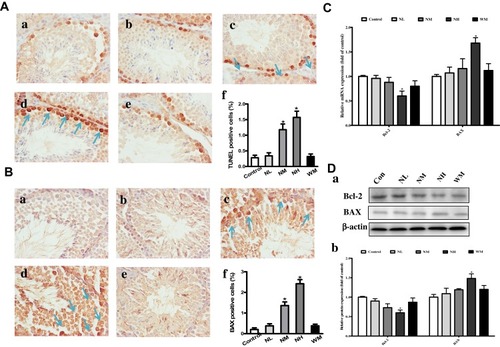
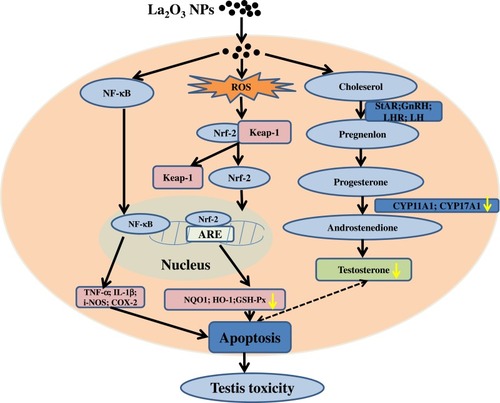
Figure 8 Schematic representation of possible mechanisms of La2O3 NPs contributing to the apoptosis of testes tissues.