Figures & data
Figure 1 Exo-si-c-Met increases the sensitivity of gastric cancer tissues to cisplatin in vivo. (A) A flow diagram depicting the in vivo experimental design. (B) the morphology of xenografted tumor tissues (n = 5). (C, D) Quantitative analysis of tumor volume (C) and weight (D). (E, F) Expression levels of c-Met in implanted tumors by qRT-PCR (E) and Western blot analysis (F). (G) Gray analysis of (F). **p < 0.01; ***p < 0.001. All error bars stand for SE.
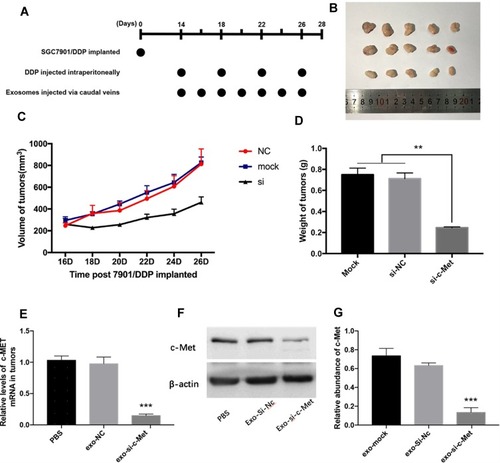
Figure 2 The expression level of c-Met in GC. (A) The survival curve of GC patients associated with c-Met expression. (p < 0.001). (B) Immunohistochemistry of the paraffin-embedded human gastric cancer tissues and paracancerous normal tissues (n=8, total of 16 samples). (C) Western blotting analysis of c-Met expression in GC tissues and the corresponding adjacent normal tissues (n=8, total of 16 samples). (D) Gray analysis of (C). *p < 0.05, **p < 0.01. All error bars stand for SE.
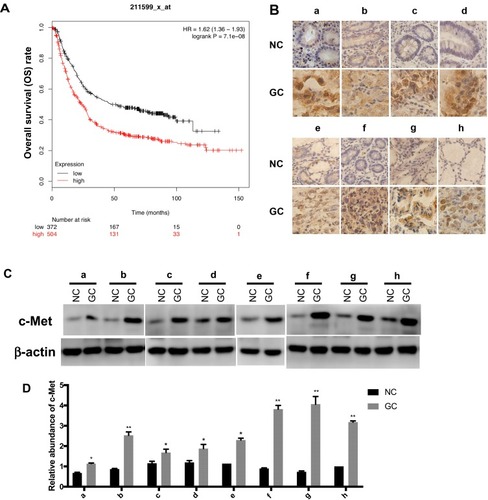
Figure 3 The role of si-c-Met. (A, B) qRT-PCR analysis was done to exam the inhibition to the expression level of c-Met mRNA. (C, D) Western blotting analysis was done to confirm the inhibiting effect of si-c-Met in gastric cancer cells. (E, F) Gray analysis of (C, D). **p < 0.01, and ***p < 0.001. All error bars stand for SE.
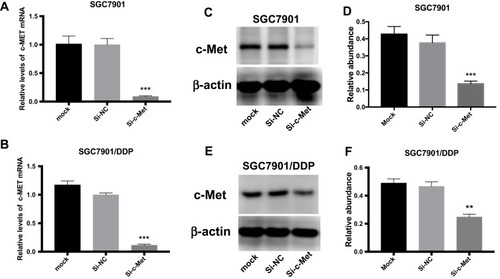
Figure 4 Exo-si-c-met fuses into cells and downregulates the expression c-met. (A) The inhibition rate of two cell lines was observed by CCK-8. (B, C) Cell viability of different drug concentrations in SGC7901 and SGC7901/DDP was tested by CCK-8, and the inhibition ratio was calculated. (D) EdU was stained to confirm the number of newly proliferating cells. (E, F) Quantitative analysis of (D) **, p<0.01; All error bars stand for SE.
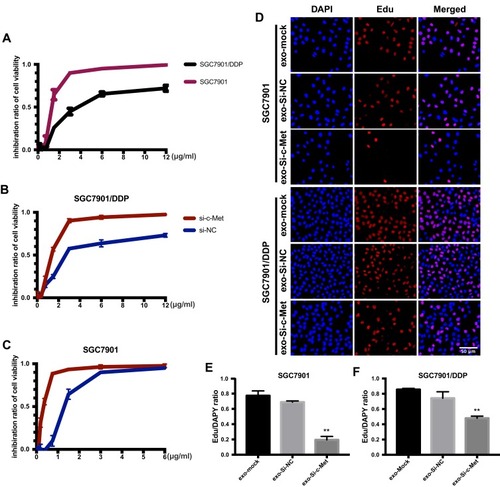
Figure 5 Exo-si-c-met fuses into cells and downregulates the expression c-met. (A) Extraction of exosomes from HEK293-T cells. (B) Electron microscope scanning of exosome from HEK293T cells. (C) Exosomes were stained with PKH26 and then fused into gastric cancer cells. (D–F) Expression levels of c-Met in exosomes from medium of SGC7901 and SGC7901/DDP were detected by Western blotting (D) and qRT-PCR (E, F) assays. (G) Gray analysis of (D). **p < 0.01, and ***p < 0.001. All error bars stand for SE.
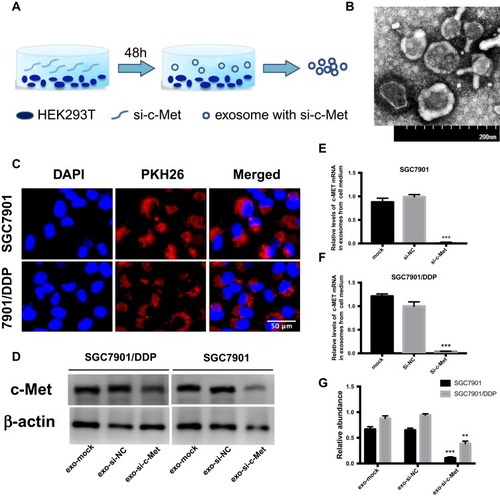
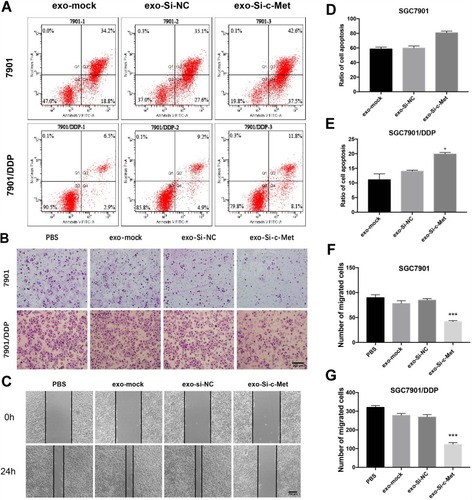
Figure 6 Exo-si-c-met increases the sensitivity of gastric cancer cells to cisplatin (A) Apoptotic rate was tested by flow cytometry. (B) Transwell assays were completed to examine the cell migration ability. (C) Wound-healing assay demonstrated that exo-si-c-Met increased SGC7901/DDP migration. (D, E) Quantitative analysis of (A). (F, G) Quantitative analysis of (B). ***p < 0.001. All error bars stand for SE.