Figures & data
Figure 1 Green synthesis of MA-AgNPs. (A) Gradual color transition of MA-extract during synthesis of MA-AgNPs between 0 h and 24 h. (B) Corresponding UV-Vis spectra of synthesized MA-AgNPs. (C) Colloidal stability of MA-AgNPs under five different solutions: deionized water, phosphate buffered saline (PBS) (pH 7.4), NaCl (0.9%), Dulbecco’s modified Eagle’s medium (DMEM) and complete medium (CM). (D) On-shelf colloidal stability of MA-AgNPs at room temperature.
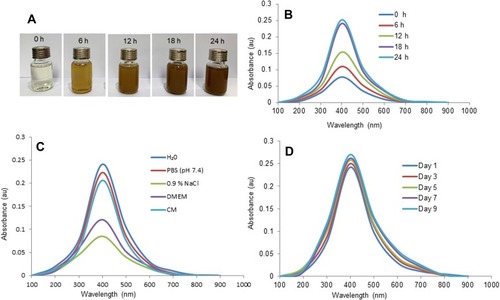
Figure 2 Characterization of green synthesized MA-AgNPs. (A) Surface morphology analysis under SEM. (B) Elemental analysis by EDX. (C) TEM image. (D) Particle diameter from TEM image. (E) FTIR spectra of MA-extract and MA-AgNPs. (F) XRD spectra.
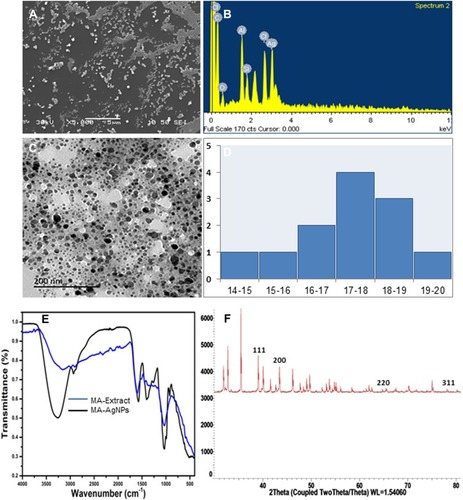
Figure 3 Antibacterial studies on Bacillus cereus and Escherichia coli by disc diffusion method. (A) Effect on growth of E. coli at 12 h of incubation: (a) negative control, (b) silver nitrate, (c) Rifampicin, (d) MA-extract, (e) MA-AgNPs. (B) Effect of MA-AgNPs on zone of inhibition (ZOI) of Bacillus cereus and Escherichia coli at different time intervals.
Abbreviations: BC, Bacillus cereus; EC, Escherichia coli.
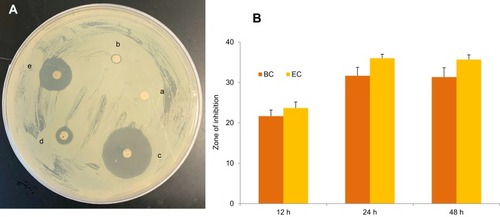
Figure 4 SEM image of antibacterial effect on (A) Bacillus cereus and (B) Escherichia coli: (a) negative control, (b) silver nitrate, (c) Rifampicin, (d) MA-extract, (e) MA-AgNPs.
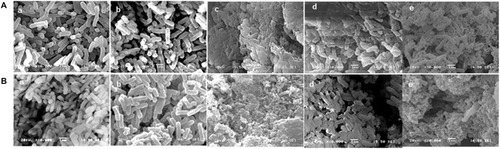
Figure 5 Wound healing effect on HDFa cells after (A) 24 h and (B) 48 h of treatment in (a) negative control, (b) silver nitrate, (c) Rifampicin, (d) MA-extract, (e) MA-AgNPs by the cell scratch assay at 10x magnifications (scale bar: 200 µm).
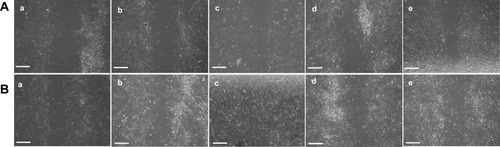
Figure 6 Antidiabetic and antioxidant potential of MA-extract and MA-AgNPs. (A) Percentage inhibition of α-amylase. (B) Percentage inhibition of α-glucosidase. (C) Percentage inhibition of DPPH radical. (D) Percentage inhibition of ABTS radical.
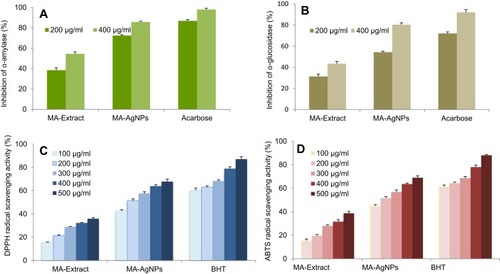
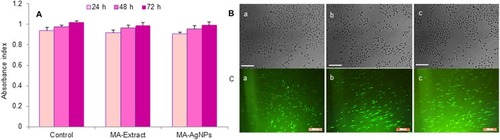
Figure 7 Cytotoxic effect of AgNPs on chang liver cell lines (A) MTS assay. (B) Optical microscopic image. (C) CMFDA dye analysis of (a) control, (b) MA-extract, (c) MA-AgNPs at 10x magnifications (scale bar: 200 µm).