Figures & data
Figure 1 Images of in vitro 3D structures. (A) 3D-printed honeycomb structure; (B) simulated top view of honeycomb structure; (C) simulated side view of honeycomb structure; (D) 3D-printed grid structure; (E) simulated top view of grid structure; (F) simulated side view of grid structure.
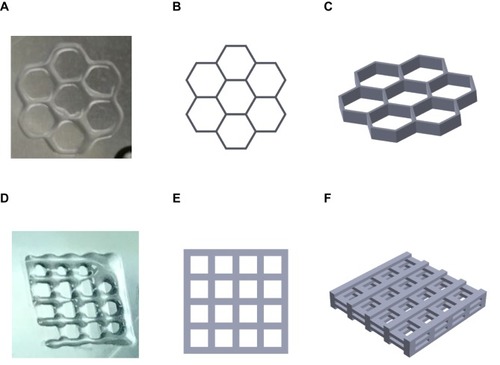
Figure 2 SEM of sub-micrometer particles. (A) Graphene; (B) GO; (C) PS. Note that as the shape of GO is a one-atom-thick sheet, it is hard to determine its mean size and aspect ratio via SEM observation.
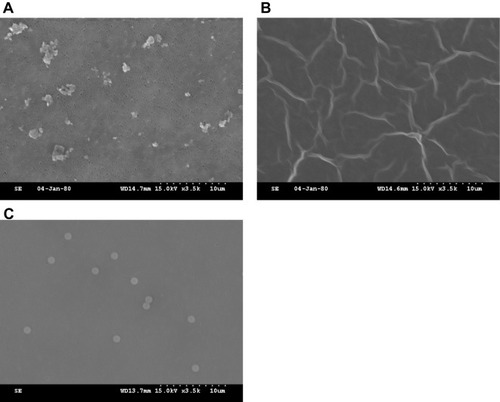
Figure 3 Cytokine secretion of cell treated with graphene or GO in different 2D/3D structures. (A) TNF-α; (B) IL-6 (mean ± SD, *p < 0.05, ***p < 0.001).
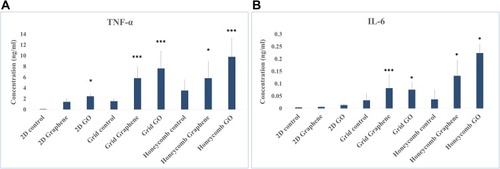
Figure 4 Micro-CT imaging analysis of murine calvarial model treated with different particles. (A) Reconstructed image of whole skull and VOI with the midline suture of the skull. The VOI is defined with a diameter of 5 mm. (B) Bone resorption parameter quantified by micro-CT in calvarial tissues (mean ± SD, *p < 0.05, **p < 0.01, ***p < 0.001).
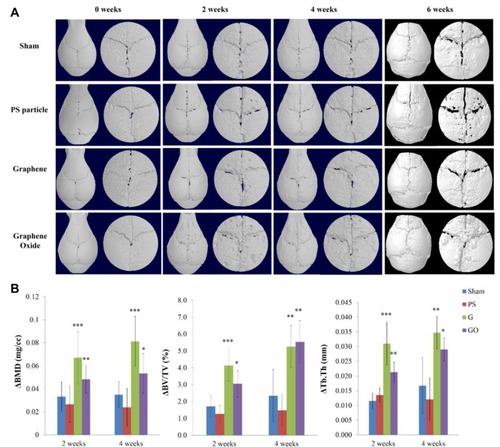
Figure 5 Photomicrograph of hematoxylin and eosin staining in murine calvarial tissues (arrow: multinucleated giant cells).
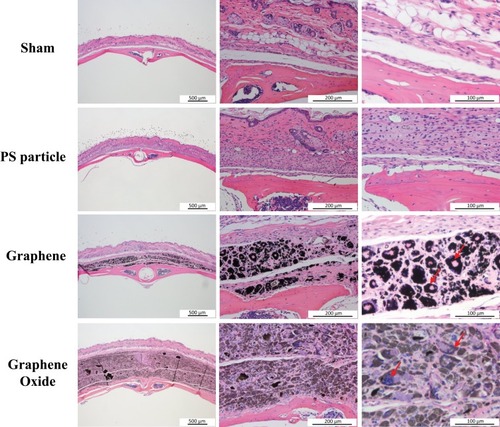
Figure 6 Photomicrograph of Masson trichrome staining in murine calvarial tissues (fibrous tissue: blue; bone: red and blue).
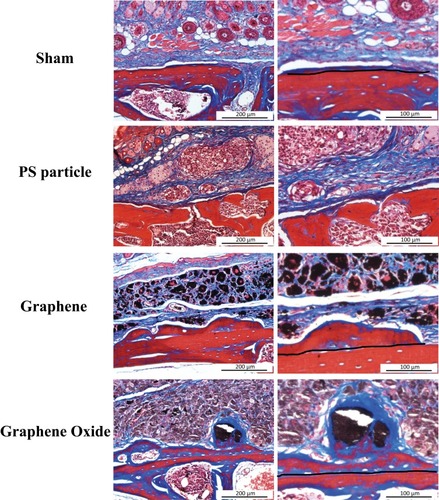
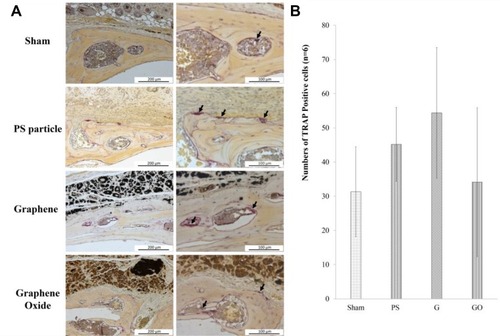
Figure 7 (A) Photomicrograph of TRAP staining in murine calvarial tissues, with osteoclast aggregation indicated by arrows. TRAP immunohistochemistry shows purple-stained TRAP + positive osteoclasts. (B) Average number of osteoclasts from each group is presented as the mean ± SD.