Figures & data
Table 1 The Composition (Molar Ratio) and the Physicochemical Properties of the Investigated (GR/CHL)-Loaded Spray Dried SXNs (Mean ± S.D., n = 3)
Figure 1 The in vitro release profile of CHL from SXNs, in comparison to an aqueous CHL suspension, in 0.1N HCl at 37 ± 0.5 °C (mean ± SD, n=3).
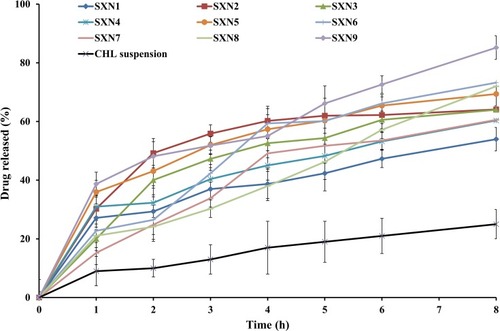
Figure 2 The in vitro release profile of GR from SXNs, in comparison to an aqueous GR solution, in 0.1N HCl at 37 ± 0.5 °C (mean ± SD, n=3).
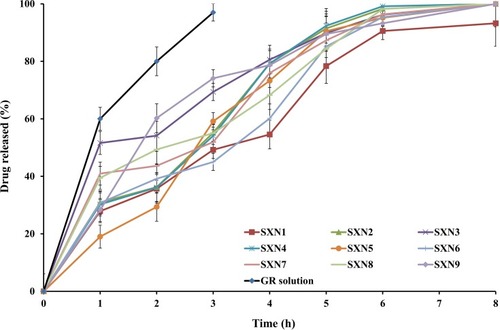
Figure 3 A scaning electron micrograph of SXN4.
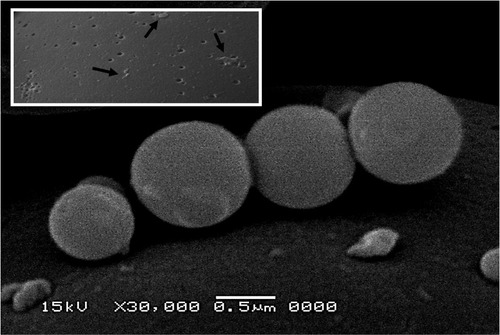
Figure 4 Pore size distribution of (GR/CHL)-loaded SXN4.
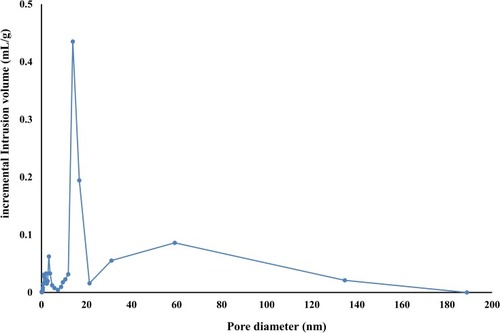
Figure 5 Photographs taken before and during in vitro wetting and floating studies of (GR/CHL)-loaded SXN4 showing the wetting time in 0.1 N HCl at 37 ± 0.5°C.
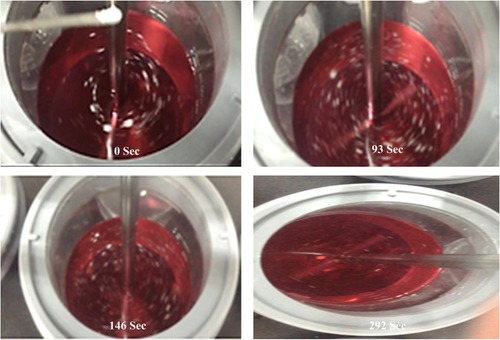
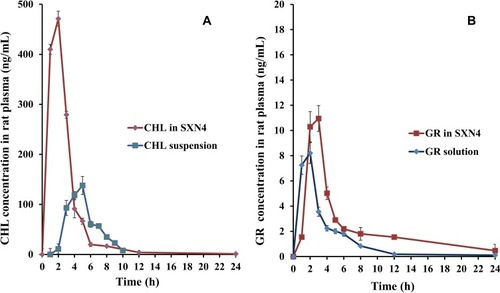
Table 2 The Estimated Pharmacokinetic Parameters of GR and CHL Following Oral Administration of SXN4 and an Aqueous CHL Suspension Containing GR in Fasted Rats (Mean ± S.D., n = 6)
Figure 6 (A) Plasma concentration-time curves of CHL from SXN4 and an aqueous CHL suspension following oral administration in fasted rats at 4 mg/mL doses, mean ± S.D., n = 6. (B) Plasma concentration-time curves of GR from SXN4 and an aqueous GR solution following oral administration in fasted rats at 2 mg/mL doses, mean ± S.D., n = 6.