Figures & data
Table 1 Basic Physical and Chemical Properties of HAP with Different Sizes
Figure 1 SEM images of HAP with different sizes (A). Cell viability (B) and LDH release (C) of HK-2 cells after injury by HAP crystals with different concentrations and sizes for 24 h. (**P<0.01, *P<0.05 vs control); Crystal concentration: 63, 125, 250, 500 μg/mL, respectively; treatment time: 24 h. Scale bars: 200 nm (HAP-40nm, HAP-70 nm), 1 μm (HAP-1μm, HAP-2μm).
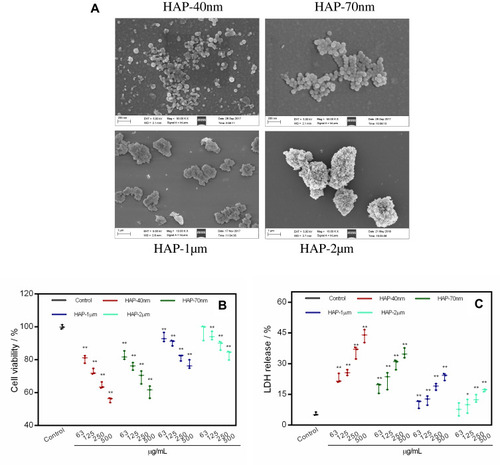
Figure 2 Cell morphology (A) and cytoskeleton (B) of HK-2 cells after injury by HAPs with different sizes. Crystal concentration: 250 μg/mL; treatment time: 24 h. Scale bars of cell morphology: 50 µm (400x). Scale bars of cytoskeleton: 20 μm (Merged images, 630x); 5 μm (Enlarged images).
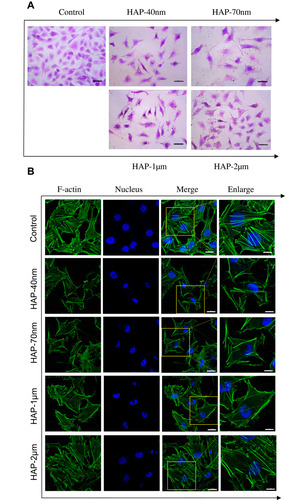
Figure 3 Intracellular ROS levels of HK-2 cells after injury by HAPs with different sizes. (A) Qualitative observation of ROS; (B) Flow cytometry analysis results of ROS; (C) ROS quantitative histogram. Crystal concentration: 250 μg/mL; treatment time: 24 h. Scale bars: 50 μm (400x).
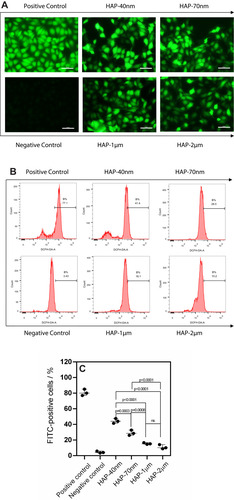
Figure 4 Flow cytometry analysis of internalized HAP crystals (A) and intracellular Ca2+ ion concentration [Ca2+]i (B) in HK-2 cells after injury by HAPs with different sizes. Quantitative analysis results of internalized HAP crystals (C) and [Ca2+]i (D). The linear relationship of cell death rate and the proportion of cells with internalized crystals (E). The linear relationship of [Ca2+]i and cell viability (F). R2 is a linear correlation coefficient. Crystal concentration: 250 μg/mL; treatment time: 24 h.
![Figure 4 Flow cytometry analysis of internalized HAP crystals (A) and intracellular Ca2+ ion concentration [Ca2+]i (B) in HK-2 cells after injury by HAPs with different sizes. Quantitative analysis results of internalized HAP crystals (C) and [Ca2+]i (D). The linear relationship of cell death rate and the proportion of cells with internalized crystals (E). The linear relationship of [Ca2+]i and cell viability (F). R2 is a linear correlation coefficient. Crystal concentration: 250 μg/mL; treatment time: 24 h.](/cms/asset/f4945fea-6903-4630-af2f-e9f7c7d348dd/dijn_a_12194420_f0004_c.jpg)
Figure 5 Mitochondrial membrane potential (Δψm) changes of HK-2 cells after injury by HAP with different sizes. (A) Qualitative observation of the changes in Δψm under fluorescence microscope; (B) Scatter plot of Δψm detected by flow cytometry; (C) Histogram for quantitative determination of aggregation degree of JC-1 in mitochondria, JC-1 monomers represent decreased Δψm. Crystal concentration: 250 μg/mL; treatment time: 24 h. Scale bars: 50 μm (200x).
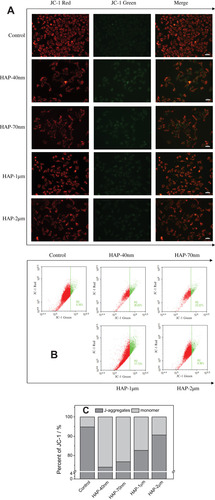
Figure 6 Changes in cell cycle distribution of HK-2 cells after injury by HAPs with different sizes. (A) Cell cycle images detected by Flow cytometry; (B) quantitative histogram of cell cycle distribution; (C) correlation between cell viability and retention capacity at G0/G1 phase. Crystal concentration: 250 μg/mL; treatment time: 24 h.
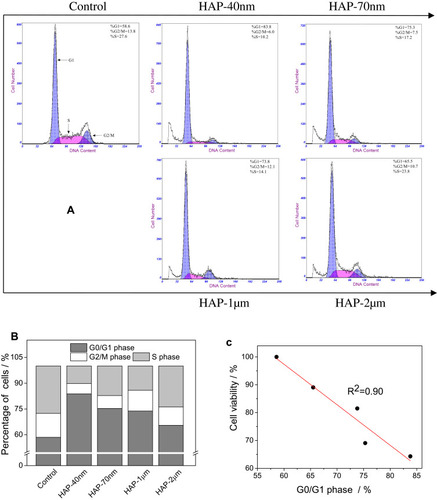
Figure 7 Changes of apoptosis and necrosis rate of HK-2 cells after injury by HAPs with different sizes. (A) Qualitative observation of apoptosis and necrosis under fluorescence microscope; (B) quantitative scatter plot of apoptosis and necrosis; (C) statistical result of necrosis rate. Crystal concentration: 250 μg/mL; treatment time: 24 h. Scale bars: 50 μm (100x).
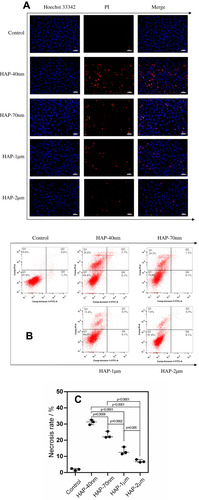
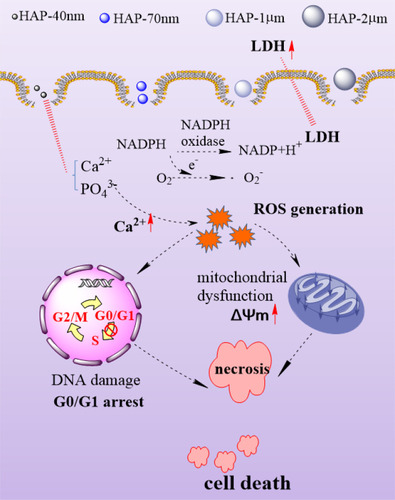
Figure 8 Schematic diagram of cytotoxicity mechanism of HK-2 cells induced by HAP with different sizes.