Figures & data
Table 1 In vitro Anti–NS3 Helicase and Protease Activities of Total Extract and Fractions of Amphimedon sp.
Table 2 In vitro Anti–NS3 Helicase and Protease Activities of the SNP Total Extract and Petroleum Ether Fraction of Amphimedon sp.
Figure 1 Compounds identified and dereplicated from high-resolution mass-spectra data sets of Amphimedon sp.
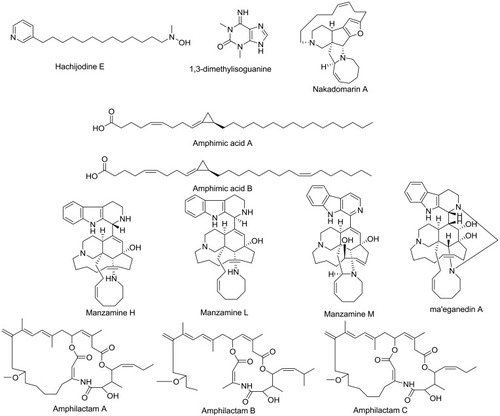
Figure 2 Structures of isolated compounds 1–14.
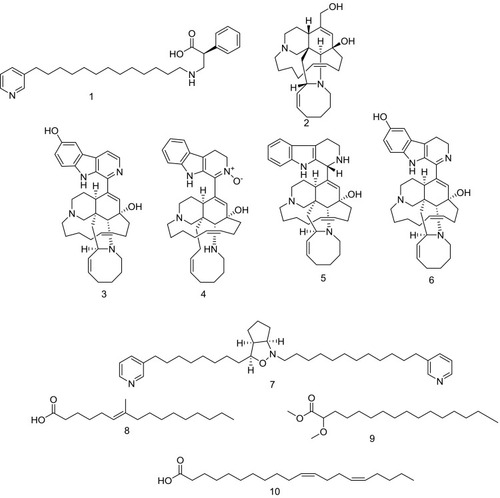
Figure 3 TEM for shape and size of produced SNPs of (A) total extract of Amphimedon sp. and (B) Petroleum ether fraction of Amphimedon.
Abbreviations: TEM, transmission electron microscopy; SNPs, silver NPs
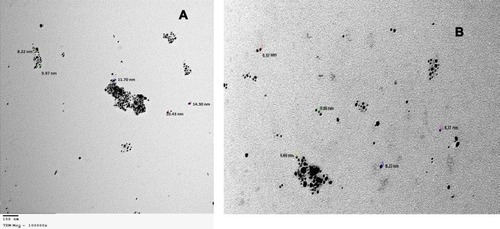
Figure 4 Ultraviolet-visible spectra analysis and color intensity of biosynthesized SNPs of (A) petroleum ether fraction of Amphimedon spp. and (B) total extract of Amphimedon.
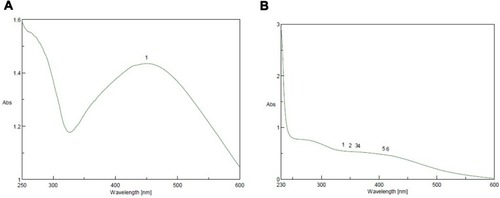
Figure 5 FTIR spectra after synthesis of nanoparticles of (A) petroleum ether fraction of Amphimedon sp. and (B) total extract of Amphimedon.
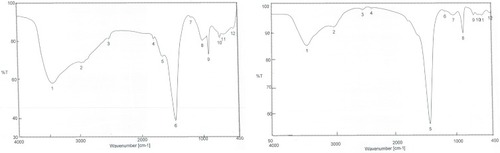
Table 3 Docking Scores (kcal/Mol) of the 14 Tested Compounds, Paritaprevir, and Ribavirin 5ʹ-Triphosphate Against Full-Length HCV NS3-4A Protease–Helicase (4A92), HCV NS3/NS4A Protease (3P82), and HCV NS3 Helicase (4WXR)
Figure 6 2-D interaction diagrams of docked compounds and ribavirin 5ʹ-triphosphate (M) with the active sites of HCV NS3 helicase (4WXR). Green arrows represent side-chain acceptor/donor; blue arrows represent backbone acceptor/donor; blue shadows represent ligand exposure.
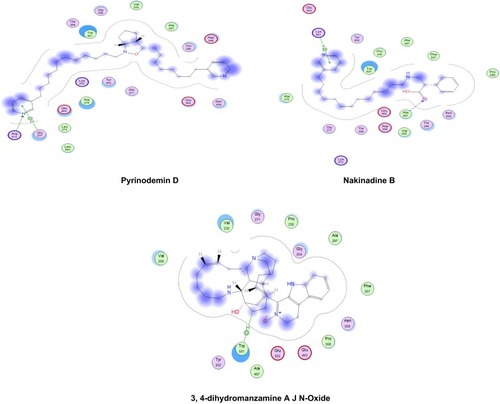
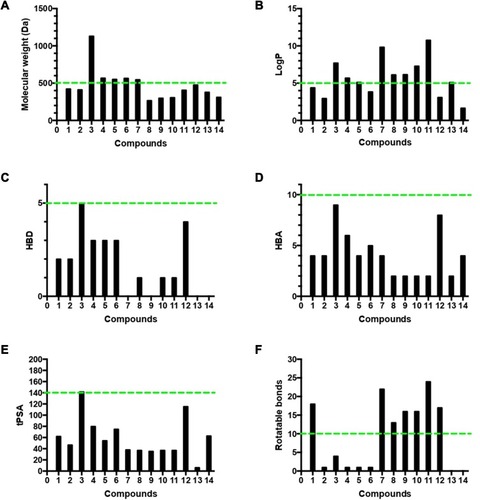
Figure 7 Analysis of physicochemical properties for the 14 isolated compounds by (A) molecular weight, (B) log P, (C) HBD, (D) HBA, (E) tPSA, and (F) number of rotatable bonds. The green line indicates the maximum desirable value for oral bioavailability defined by Lipinski’s rule of five and Veber’s oral bioavailability rule.