Figures & data
Figure 1 Field emission scanning electron microscopy images of (A) graphite flakes, (B) large area graphene oxide sheets, and (C) sonicated graphene oxide sheets.
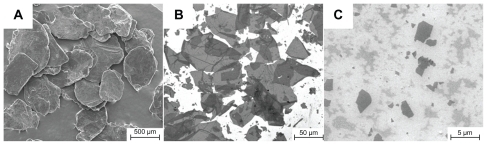
Figure 2 Photographs of (A) graphene HG-0.1 (i), graphene HG-0.5 (ii), graphene HG-1 (iii) and graphene HG-2 (iv), and (B) comparison of graphene HGS-2 (i) and graphene HG-2 (ii).
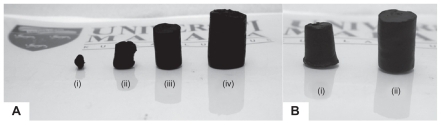
Figure 3 Field emission scanning electron microscopy images of (A) graphene HG-2 and (B) graphene HGS-2.
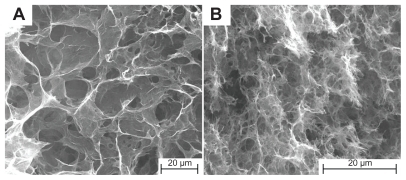
Figure 4 X-ray diffraction patterns of (A) graphite flakes, (B) graphene oxide nanosheets, (C) graphene HG-0.5, (D) graphene HG-2, and (E) graphene HGS-2.
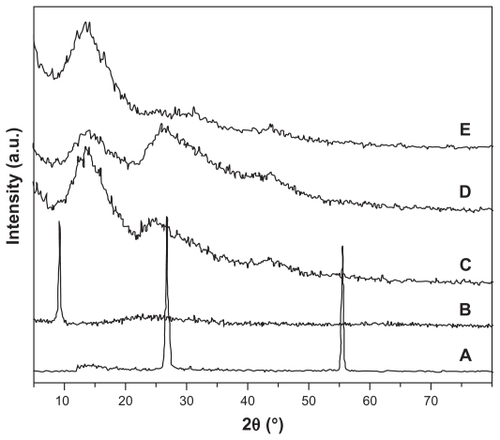
Figure 5 Fourier transform infrared spectra of (A) graphite flakes, (B) graphene oxide, and (C) graphene hydrogel.
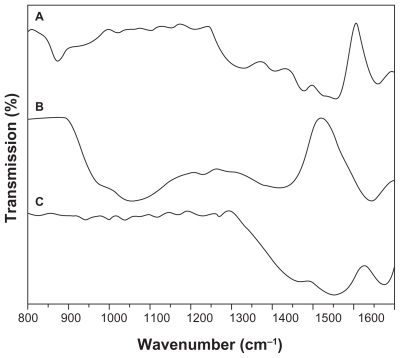
Figure 6 Optical density measurement of cell proliferation on graphene HG-2 and control after 1, 3, 5, and 7 days of culture time (P < 0.001, n = 3).
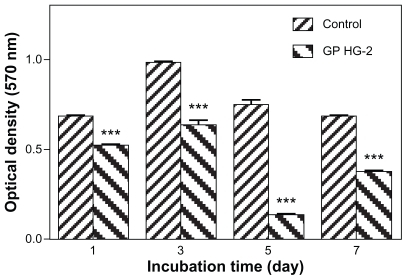
Figure 7 Field emission scanning electron microscopy images of the cells grown on graphene HG-2 after culturing for 1, 3, 5, and 7 days. All the images share the same scale bar.
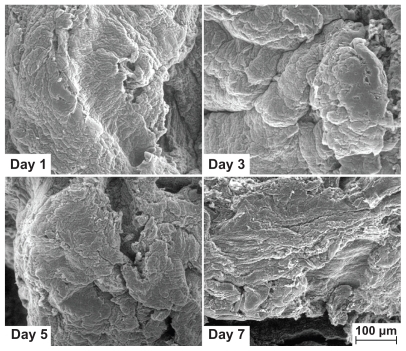
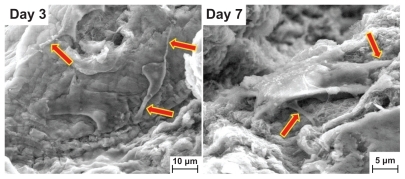
Figure 8 Guided filopodia protrusions of MG63 on graphene HG-2 after 3 and 7 days of culture time observed at higher magnifications.