Figures & data
Table 1 Compositions of Electrosprayed Ternary Solid Dispersions
Figure 1 Saturation solubility of bezafibrate in 1% (w/v) aqueous solution of hydrophilic excipients: (A) hydrophilic polymeric matrices and (B) surfactants. Each value represents the Mean ± SD (n = 3).
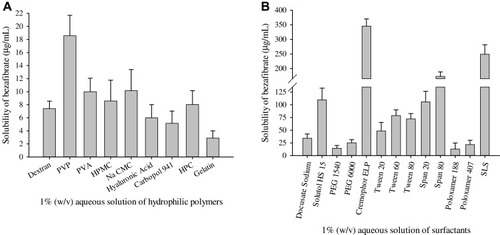
Figure 2 Effect of cremophor ELP (I-III) and PVP K30 (IV-VII) on the aqueous solubility (A) and dissolution rate (B) of bezafibrate in electrosprayed ternary solid dispersions. Each value denotes the Mean ± SD (n = 3 and n = 6, respectively). Solubility and dissolution of bezafibrate with physical mixture (PM) is also shown.
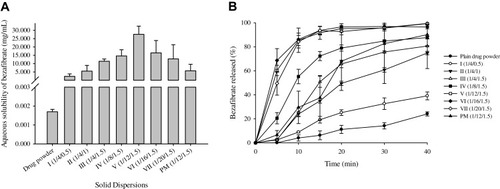
Figure 3 XRD patterns: (A) bezafibrate, (B) PVP K30, (C) Cremophor ELP, (D) physical mixture and (E) electrosprayed ternary solid dispersion formulation V.
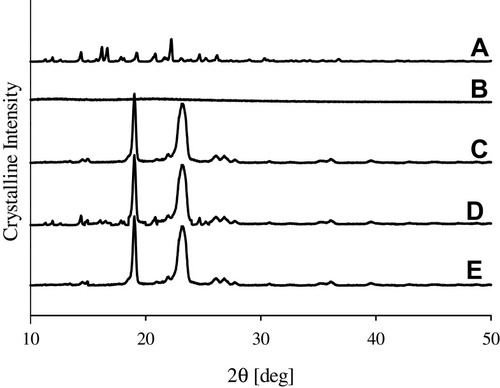
Figure 4 DSC thermograms: (A) bezafibrate, (B) PVP K30, (C) Cremophor ELP, (D) physical mixture and (E) electrosprayed ternary solid dispersion formulation V.
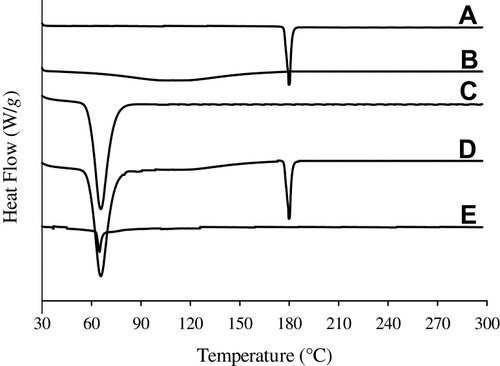
Figure 5 SEM images: (A) bezafibrate (× 5000) and (B) electrosprayed ternary solid dispersion formulation V. (× 10,000).
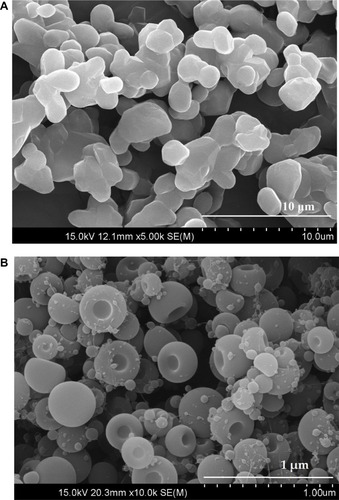
Figure 6 FTIR spectra: (A) bezafibrate, (B) PVP K30, (C) Cremophor ELP, (D) physical mixture and (E) electrosprayed ternary solid dispersion formulation V.
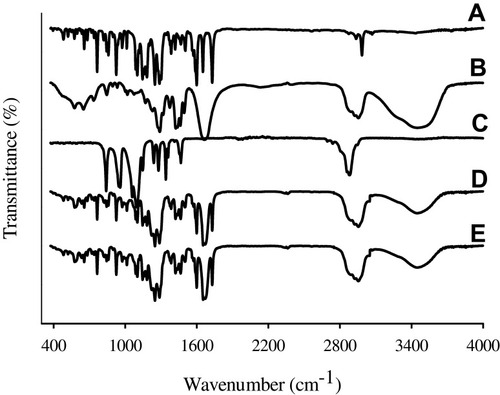
Table 2 Pharmacokinetic Parameters
Figure 7 Plasma level-time profiles: (A) bezafibrate and (B) electrosprayed ternary solid dispersion formulation V. *p < 0.05 as compared to bezafibrate plain powder.
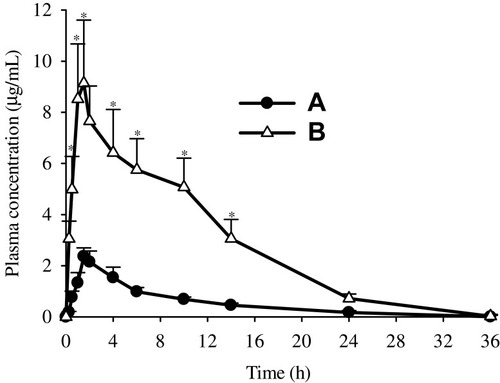
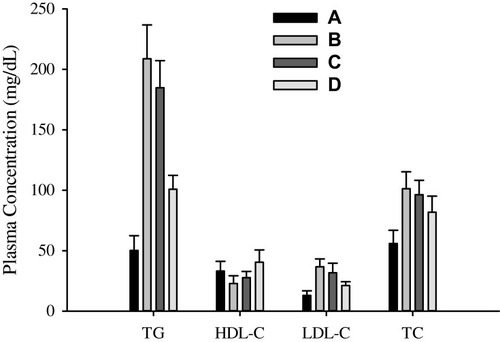
Figure 8 Lipid profile characteristics: (A) negative control, (B) positive control, (C) bezafibrate and (D) electrosprayed ternary solid dispersion formulation V.
Abbreviations: TG, triglycerides; HDL-C, high-density lipoprotein cholesterol, LDL-C, low-density lipoprotein cholesterol; TC, total cholesterol.