Figures & data
Figure 1 500 mHz 1H-NMR spectra at 25°C of (A) cyclodextrin 14 mg (B) erythromycin 6 mg (C) cyclodextrin-erythromycin 20 mg (MV) (7/3, w/w) complex, (D) 20 mg of cyclodextrin-erythromycin (MVI) (7/3, w/w) complex in 750 μL of D2O ranging from 0.5 to 5.5 ppm. Important proton chemical shifts and peak integrations of solutes are labeled.
Abbreviations: MV, method V; MVI, method VI.
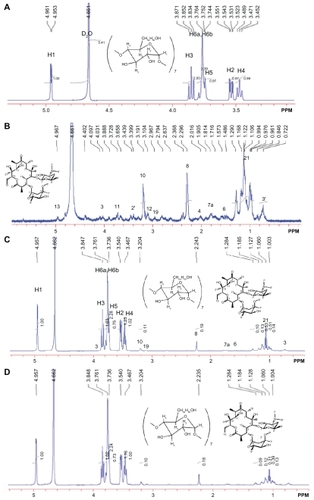
Figure 2 500 mHz 13C-NMR spectra at 37°C of 30 mg of cyclodextrin, 30 mg of cyclodextrin-erythromycin (MV) (7/3, w/w) complex, 30 mg of cyclodextrinerythromycin (MVI) (7/3, w/w) complex in 1 mL of D2O. Important carbons (C1–C6 and C from erythromycin) chemical shifts and peak integrations of solutes are labeled.
Abbreviations: CD, cyclodextrin; CD-EM, cyclodextrin-erythromycin; MV, method V; MVI, method VI.
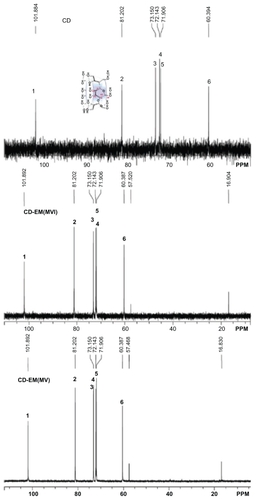
Table 1A Proton chemical shift of cyclodextrin
Table 1B Proton chemical shift of erythromycin
Table 1C Carbon chemical shift of cyclodextrin
Figure 3 Three-dimensional molecular structure of cyclodextrin-erythromycin complex. Yellow, erythromycin; pink, cyclodextrin 1; green, cyclodextrin 2; blue, cyclodextrin 3.
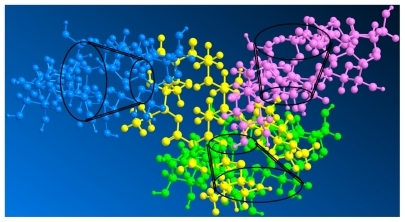
Figure 4 X-ray diffraction spectra for pure cyclodextrin, cyclodextrin-erythromycin (MV and MVI) before freeze-drying, and pure erythromycin. The Y axis (counts) of the diffraction pattern is vertically offset for clarity. Blue-peaks disappeared in spectra of CD-EM complex. Red-new peaks in spectra of CD-EM complex. Yellow-characteristic peaks of EM in in spectra of CD-EM complex.
Abbreviations: CD, cyclodextrin; EM, erythromycin; MV, method V; MVI, method VI.
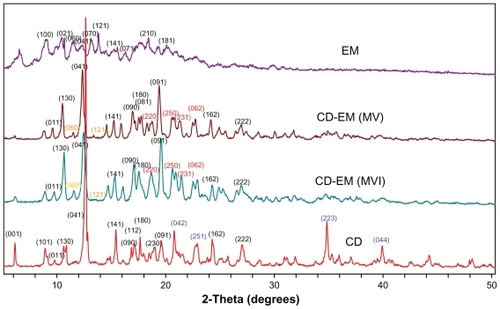
Figure 5 Ultraviolet spectra of (A) pure erythromycin, (B) pure cyclodextrin, (C) cyclodextrin-erythromycin (MV), and (D) cyclodextrin-erythromycin (MVI) from 200 nm to 300 nm with a step size of 1 nm.
Abbreviations: MV, method V; MVI, method VI.
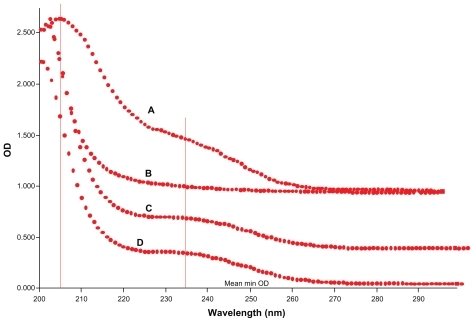
Figure 6 Scanning electron microscopic morphologies of (A, 100×; D, 300×) cyclodextrin, (B, 300×; E, 1000×) erythromycin and (C, 300×; F, 1000×) cyclodextrinerythromycin (MVI).
Abbreviation: MVI, method VI.
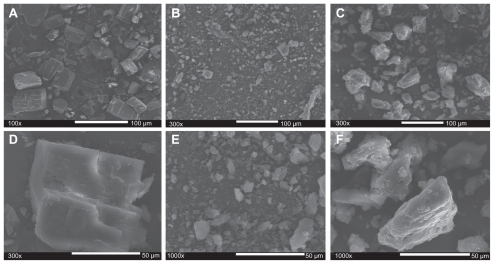
Figure 7 Drug stability profiles of (A) erythromycin and (B) cyclodextrinerythromycin dissolved in 5 mL D-H2O at 37°C.
Note: Measurable percentage of erythromycin against time; n = 3.
Abbreviations: CD, cyclodextrin; EM, erythromycin.
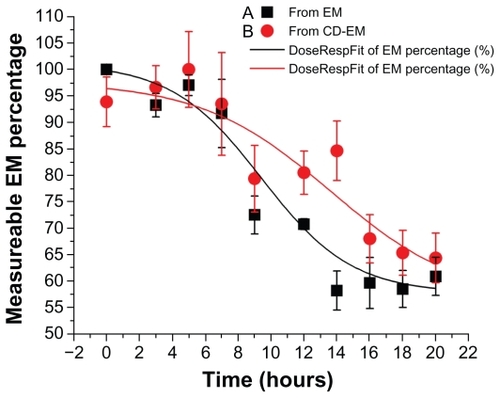
Figure 8 Bactericidal effect assay. (A) Semiquantitative bacteria growth inhibition assay in 2 mL broth in the presence of cyclodextrin-erythromycin with gradient concentrations (53, 106, 159, and 212 μg/mL) for 24 hours, respectively. (B) Semiquantitative bacteria growth inhibition assay in 2 mL broth in the presence of erythromycin 64 μg/mL, cyclodextrin 148 μg/mL, and cyclodextrin-EM 212 μg/mL at predetermined time points, respectively.
Notes: All dots were exponentially fitted; P < 0.05 related to 0 versus 159 and 212 μg/mL; n = 4.
Abbreviations: CD, cyclodextrin; EM, erythromycin.
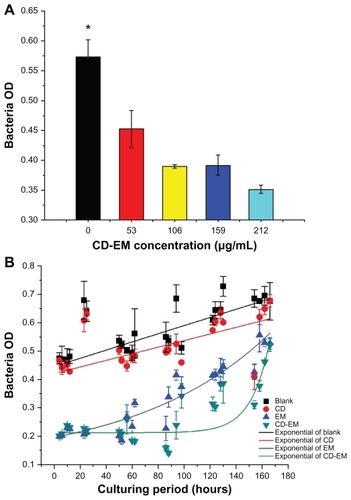
Figure 9 MC-3T3 cell activity assay. The live (green)-dead (red) staining (original magnification, ×50) of MC3T3 cells cultured for 16 days in the presence of (2) erythromycin 1.6 mg/mL, (3) cyclodextrin 3.7 mg/mL, and (4) cyclodextrin-erythromycin 5.3 mg/mL. ALP activity of MC-3T3 cells cultured under the same conditions in the presence of drugs with (A) higher concentrations of erythromycin (1.6 mg/mL), cyclodextrin (3.7 mg/mL), and cyclodextrin-erythromycin (5.3 mg/mL) and (B) lower concentrations of erythromycin (16 μg/mL), cyclodextrin (37 μg/mL), and cyclodextrin-erythromycin (53 μg/mL).
Note: *P < 0.05 related to control versus cyclodextrin and cyclodextrin-erythromycin; n = 6.
Abbreviations: ALP, alkaline phosphatase; CD, cyclodextrin; EM, erythromycin.
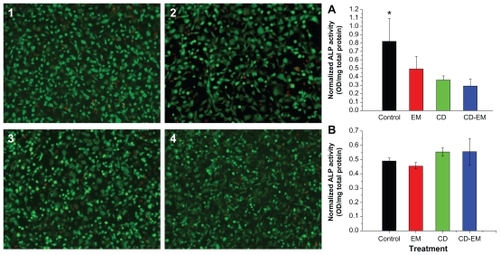
Figure 10 Erythromycin inhibits the amount of RANKL-induced TRAP+ cell formation in murine RAW 264.7 cells. (A–E) Representative TRAP staining (original magnification, ×100): (A) RANKL (−); (B) RANKL (+); (C) RANKL (+) + erythromycin (16 μg/mL); (D) RANKL (+) + cyclodextrin (37 μg/mL); and (E) RANKL (+) + cyclodextrin-erythromycin (53 μg/mL). TRAP+ cells were quantified by Image Analysis software (bottom panel). The value represents TRAP+ cells location quantified as area percentage of TRAP+ cells (%). Values represent averages of triplicate cultures from one representative experiment.
Notes: Using analysis of variance, *P < 0.05 refers to RANKL (+) + cyclodextrin 37 μg/mL versus RANKL (−), RANKL (+) + erythromycin 16 μg/mL, and RANKL (+) + cyclodextrin-erythromycin 53 μg/mL; **P < 0.05 related to RANKL (+) + cyclodextrin-erythromycin 53 μg/mL versus RANKL (−); n = 3.
Abbreviations: CD, cyclodextrin; EM, erythromycin; RANKL, receptor activator of nuclear factor kappa-B ligand.
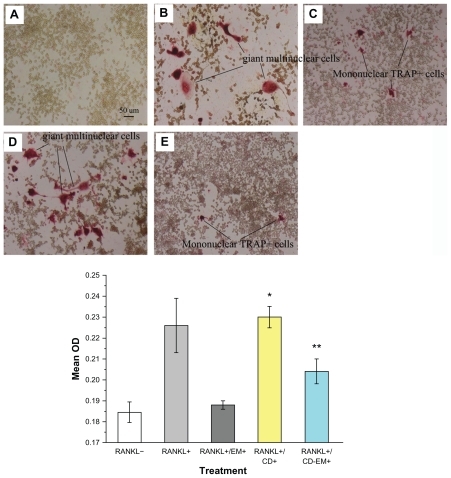
Figure 11 Lactate dehydrogenase activity in (A) culture medium of MC-3T3 cells after drug treatment [higher concentrations of erythromycin (1.6 mg/mL), cyclodextrin (3.7 mg/mL), and cyclodextrin-erythromycin (5.3 mg/mL)] for 6, 11, and 16 days, n = 6; (B) in culture medium of RAW 264.7 cells after drug treatment [lower concentrations of erythromycin (1.6 ug/mL), cyclodextrin (3.7 ug/mL), and cyclodextrin-erythromycin (5.3 ug/mL)] for 4 and 7 days, n = 3.
Note: The values shown are the mean ± standard error of the mean from six observations.
Abbreviations: CD, cyclodextrin; EM, erythromycin; LDH, lactate dehydrogenase.
![Figure 11 Lactate dehydrogenase activity in (A) culture medium of MC-3T3 cells after drug treatment [higher concentrations of erythromycin (1.6 mg/mL), cyclodextrin (3.7 mg/mL), and cyclodextrin-erythromycin (5.3 mg/mL)] for 6, 11, and 16 days, n = 6; (B) in culture medium of RAW 264.7 cells after drug treatment [lower concentrations of erythromycin (1.6 ug/mL), cyclodextrin (3.7 ug/mL), and cyclodextrin-erythromycin (5.3 ug/mL)] for 4 and 7 days, n = 3.Note: The values shown are the mean ± standard error of the mean from six observations.Abbreviations: CD, cyclodextrin; EM, erythromycin; LDH, lactate dehydrogenase.](/cms/asset/71aa9266-28ec-4940-a735-1e925c86545a/dijn_a_23530_f0011_c.jpg)