Figures & data
Figure 1 Anti-tumor effects of BP/LPPC in DBTRG tumor-bearing mice.
Notes: (A) Nude mice bearing DBTRG-05MG tumors were treated by i.v. or i.t. injection with vehicle, BP (100 mg/kg) or BP/LPPC (100 mg/kg) every 3 days. Tumor volumes were measured every 2 days (n=8). *: P < 0.05 compared with control group; #: P < 0.05 compared with BP group. (B) The survival of treated mice was recorded every day. (C) Accumulation of BP in tumors in treated mice. (D) Biodistribution of BP. The images were analyzed by a microscopy at 400×. Blue fluorescence indicated BP accumulation. *: P < 0.05 compared with PBS group. (E) The expression of PCNA and cleaved caspase-3 in the tumor area were observed by immunohistochemistry staining. (F) The expressions of VEGF, VEGFR1, VEGFR2, MMP2 and MMP9 in the tumor area were also observed by immunohistochemistry staining.
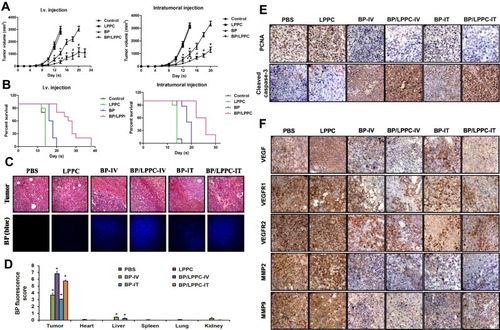
Figure 2 Anti-tumor effects of BP/LPPC in a syngenic rat glioblastoma in situ model.
Notes: RG2 cells (5 × 10⁴) were implanted i.c. (striatum) in F344 rats. (A) Tumor volume shown by MRI imaging of serial sections (1.5 μm thick): Vehicle-IV 1–5 were from the control rats; BP-IV 1–5 were from BP-treated rats by i.v. injection; BP/LPPC-IV 1–5 were from BP-treated rats by i.v. injection; BP-SC1–5 were from 300 mg/kg BP-treated rats by s.c. injection. Tumor mass in each mouse is shown by the yellow arrow. (B) Tumor volume was calculated using echo-planar imaging capability. Each column represents mean ± SEM (n=5 in each group, *P < 0.05, **P < 0.01). (C) The survival of treated mice was recorded daily. (D) Accumulation of BP in tumors in treated rats. The images were analyzed by microscopy at 400×. Blue fluorescence indicated the BP accumulation. (E) PCNA and cleaved caspase-3 and (F) VEGF, VEGFR1 and VEGFR2 expression in BP/LPPC treated rats. Immunohistochemical staining was performed in rat brain tumor tissues on day 13 after treatment at 400×.
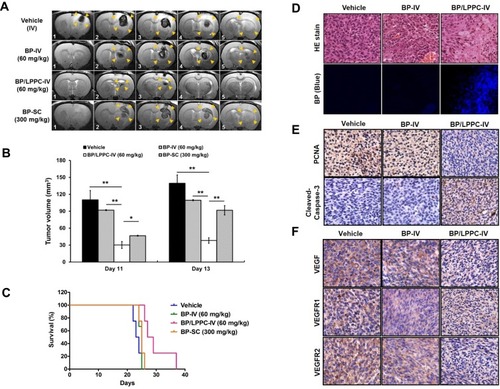
Table 1 Cytotoxicity of BP/LPPC (IC50) in Different Brain Tumor and Normal Cells
Figure 3 Uptake of BP/LPPC complex in glioblastoma cells.
Notes: (A) DBTRG-05MG or (B) RG2 cells were pre-treated with AHH, FIII or CPZ for 1 h and treated w/o BP/LPPC. Amount of BP in the cells was measured (n=3). *: P<0.05 compared with all inhibitor-treated groups.
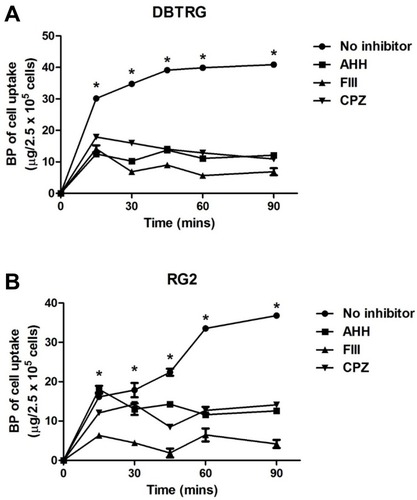
Figure 4 BP/LPPC-induced cell-cycle arrest and apoptosis in glioblastoma cells.
Notes: (A) DBTRG-05MG and RG2 cells were arrested in the G0/G1 phase with BP or BP/LPPC treatment. The proportions of cells at (B) G0/G1, S and G2/M phases and (C) after treatment. Flow cytometric analysis of DNA content in the cells treated with BP for 12 h (gray bars), cells treated with BP/LPPC for 12 h (black bars) and control cells (open bars) revealed the proportions of cells at different stages. Each column represents the mean ± SD (*P < 0.05).
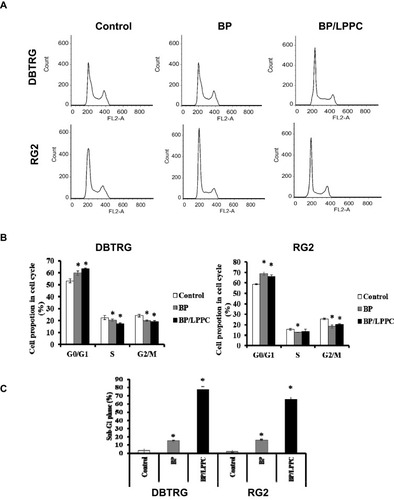
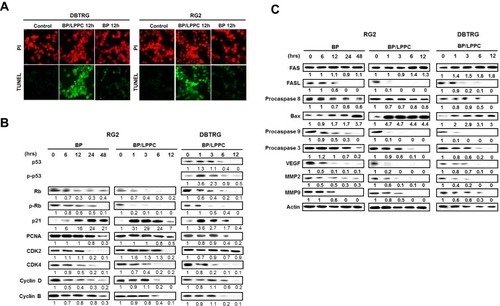
Figure 5 BP/LPPC induced apoptotic cell death and regulated the cell cycle checkpoints.
Notes: (A) DBTRG-05MG and RG2 cells underwent apoptotic cell death after 12 h treatment with BP or BP/LPPC. The apoptotic cells were determined by TUNEL assay for DNA fragmentation (green) and PI counterstaining for genomic DNA (red). (B) The expression and activation of apoptosis-associated molecules in glioblastoma cells treated with BP/LPPC. Whole cell lysates (20 µg/lane) were analyzed with Western blotting using specific antibodies to: p53, phospho-p53, Rb, phospho-Rb, p21, PCNA, cdk2, cdk4, cyclin D and cyclin B; (C) Fas, Fas-L, procaspase 8, Bax, procaspase 9, procaspase 3, VEGF, MMP2 and MMP9.