Figures & data
Figure 1 Absorption spectra of the fluorophore RH and CG ethanol solution. Emission spectra in ethanol solution of RH (red line, λex= 540 nm) and CG (black line, λex= 690 nm) and as 1:1 (w/w) mixture RH+CG measured at λex= 540 nm (blue line) and λex= 690 nm (green line).
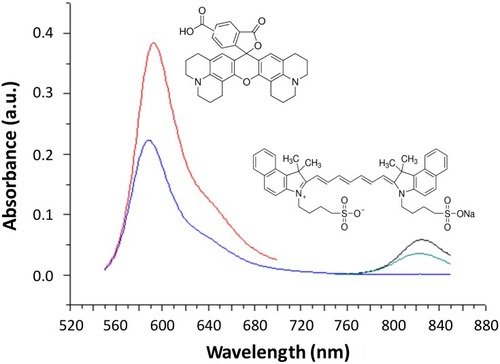
Figure 2 Emission spectra of SLN-RH (A), SLN-CG (B), mixture of SLN-RH and SLN-CG (C) and co-loaded SLN-RH/CG (D). Emission spectra are obtained at different excitation wavelength λex= 540 nm (dotted line) and λex= 690 nm (full line). RH spectra: red line; CG spectra: green line.
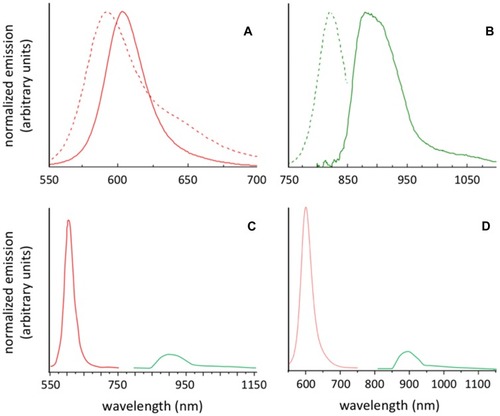
Figure 3 Macroscopic appearance of SLN-CG (A), SLN-RH (B), SLN-CG/RH (C) and cryo-TEM photomicrograph of SLN-CG/RH (D).
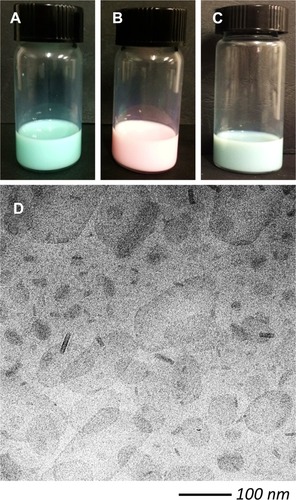
Table 1 Dimensional Size, Polydispersity and Zeta Potential of Fluorescent SLN-CG/RH
Figure 4 Plot of the kinetic uptake in the abdominal region (A, B) up to 4 h after injection; SLN biodistribution in living animals 3 h after ip injection (C, D), and fluorescent emission in excised and perfused liver (E, F). (A, C and E) refer to SLN-CG; (B, D and F) refer to SLN-CG/RH.
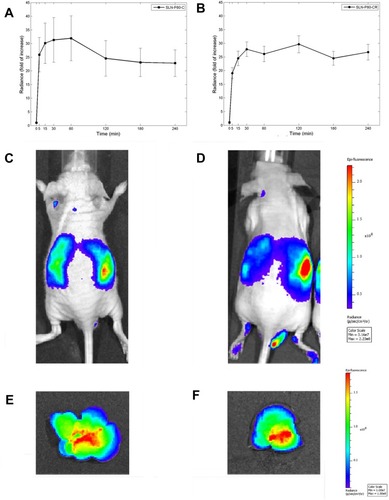
Figure 5 Light microscopy images of liver sections from control (A–D) and SLN-CG/RH-treated (E–H) mice. (A, E) brightfield images; (B, F) red signal from RH contained in SLN; (C, G) blue signal from DNA stained with Hoechst; (D, H) merge of brightfield image, red and blue fluorescence. Note the red fluorescence signal inside the hepatocytes of the treated mouse. V: centrilobular vein. Bars 50 µm.
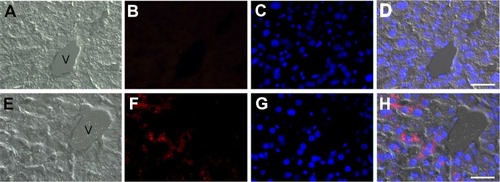
Figure 6 Light microscopy images of liver sections from control (A) and SLN-treated (B) mice; note the large amounts of lipid droplets in B (Oil Red O staining). V: centrilobular vein. Bars, 100 µm.
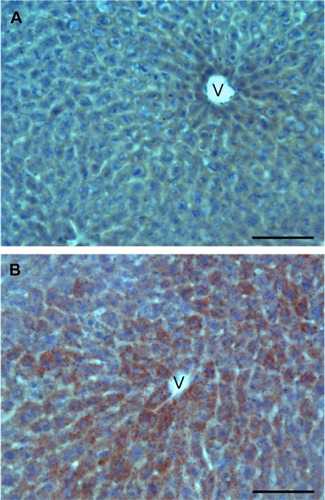
Figure 7 TEM images of liver from control (A) and SLN-treated (B–D) mice. Note the high number of lipid droplets (L) in the hepatocytes of SLN-treated mouse. Some lipid droplets showing a finely granular electron-dense border are extruded from the cell (arrow in (B); high magnification in (C). In addition, the hepatocyte in (B) shows a loosened appearance, with euchromatic nucleus (N), dispersed glycogen clusters (asterisks) and rough endoplasmic reticulum cisternae (ER) arranged in a less orderly pattern (D) in comparison to control (A). Bars 2500 nm (A, B); 1000 nm (C, D).
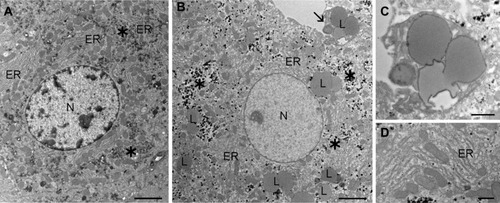
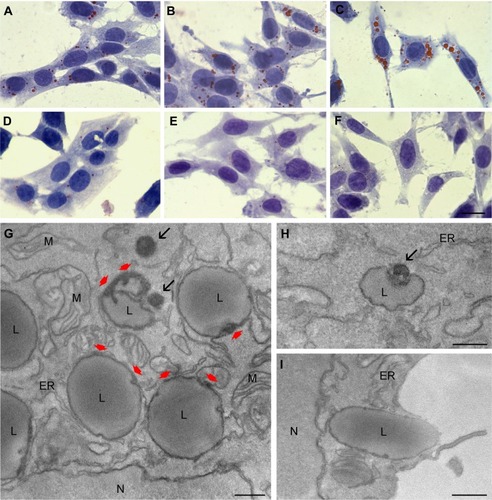
Figure 8 Light (A–F) and transmission electron (G–I) micrographs of 3T3 cells. 3T3 cells after 1 h (A), 4 h (B) and 24 h (C) treatment with SLN: lipid droplets (stained with Oil Red (O) progressively increase in number and size. 3T3 control cells after 1 h (D), 4 h (E) and 24 h (F) in medium without nanoparticles: only a few small lipid droplets are visible. 3T3 cells after 1 h treatment with SLN (G, H): many lipid droplets (L) are distributed in the cytoplasm, sometimes showing a finely granular border (red arrows). Three SLN (arrows) occur free in the cytoplasm, two of them very close to lipid droplets. After 4 h (I) treatment with SLN, some lipid droplets (L) were extruded from the cells. Note that cytoplasmic organelles such as mitochondria (M) and endoplasmic reticulum (ER), and cell nuclei (N) are well preserved after SLN treatment. Bars 50 µm (A–F); 500 nm (G–I).