Figures & data
Figure 1 Effects on proliferation of testicular cell lines by Cur-PLGA-NPs treatment. Blank, untreated; PLGA, 50 μM PLGA-NPs treatment; Cur, 50 μM curcumin treatment; Cur-PLGA, 50 μM Cur-PLGA-NPs treatment. (A) Effects on proliferation of C18-4 spermatogonia cell line by 50 μM curcumin or Cur-PLGA-NPs treatment for continuous 48 h. (B) Effects on proliferation of TM3 Leydig cell line by 50 μM curcumin or Cur-PLGA-NPs treatment for continuous 48 h. (C) Effects on proliferation of TM4 Sertoli cell line by 50 μM curcumin or Cur-PLGA-NPs treatment for continuous 48 h. a, P<0.05 when compared to Blank control. b, P<0.05 when compared to PLGA-NPs vehicle control. c, P<0.05 when compared to uncapsuled Curcumin group.
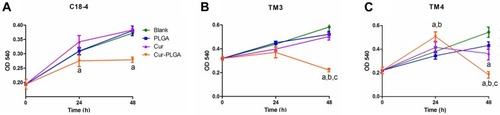
Figure 2 Morphologic changes of TM4 cells by Cur-PLGA-NPs treatment under transmission electron microscopy. (A) Control group treated by 50 μM PLGA-NPs, arrowhead indicating the anchoring junction structure. (B) Experimental group treated by 50 μM Cur-PLGA-NPs, no anchoring junctions were found. Bar = 500 nm. (C–D) TM4 cells in experimental group showing typical signs of apoptosis, including chromatin condensation, nuclei fragmentation and degenerated organelles. Bar = 2 μm.
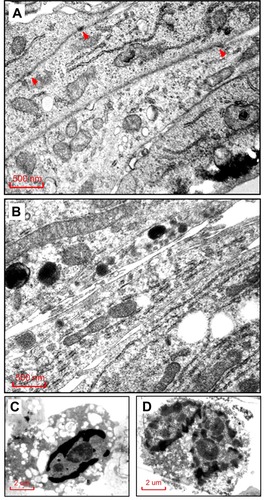
Figure 3 Impaired sperm motility by Cur-PLGA-NPs treatment in vivo. (A) Weight of body, testis, epididymis and seminal vesicle. (B) Serum testosterone level. (C) Sperm concentration and (D) Sperm motility. *P< 0.05.
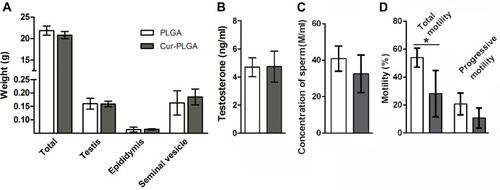
Figure 4 Disrupted structure of seminiferous epithelia by Cur-PLGA-NPs treatment. (A) Representative macroscopic images of testicular sections. Bar = 500 μm.(B) Relative volume (%) of tubular lumen. **P< 0.01.(C) Morphologic changes in different stages during spermatogenesis. Bar = 50 μm.
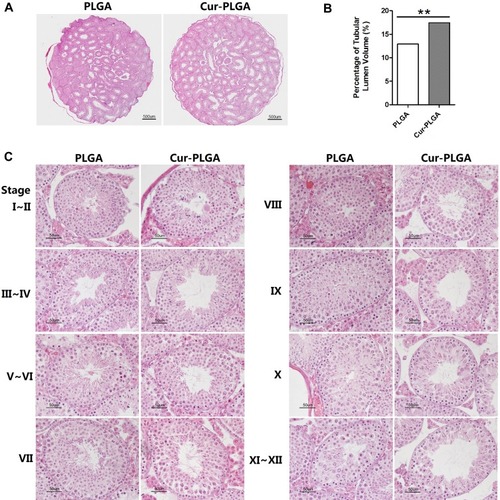
Figure 5 Disturbed spermatogenic progress by Cur-PLGA-NPs treatment. (A) Analysis of the proportion of spermatogenic stages. *P< 0.05. **P< 0.01. (B) Disorder in the seminiferous epithelia. Asterisk, tubules can not be classified; arrow, multinucleated giant cell; arrowhead, vacuole. Bar = 50 μm.
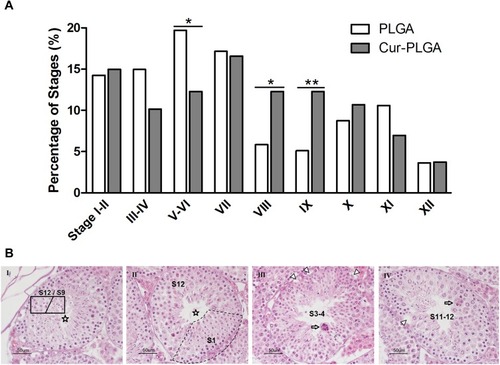
Figure 6 Induced apoptosis of spermatogenic cells by Cur-PLGA-NPs treatment. (A) Control group treated by 50 μM PLGA-NPs. (B–D) Experimental group treated by 50 μM Cur-PLGA-NPs. Asterisk, the representative affected tubules; arrow, spermatogonia. Bar = 100 μm. (E). Quantitative measurement of apoptotic events. **P< 0.01.
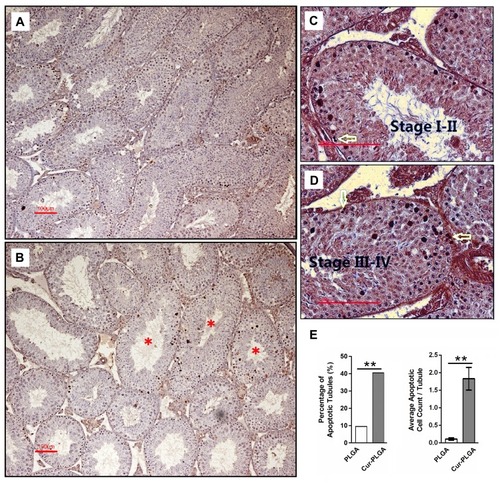
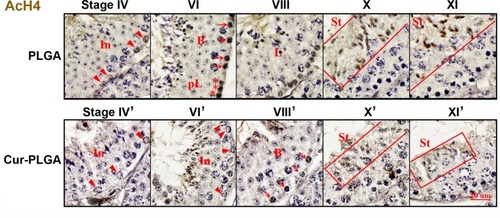
Figure 7 Inhibition on acetylated histone 4 expression by Cur-PLGA-NPs treatment. In (arrowhead), intermediate spermatogonia; B (arrow), B type spermatogonia; pL (asterisk), preleptotene spermatocytes; L, leptotene spermatocytes; St, elongating spermatids. Bars=20 μm.