Figures & data
Figure 1 (A) Photomicrograph of linear structures of MNPs formed without exposure to a magnet. (B) Photograph of the original MIRT tray, with straight lanes allowing for direct comparison of different experimental conditions such as MNP concentration, fluid composition, and cellular lining of the lanes. (C) Photograph of a representative MIRT tray with branched lanes (rotated and at reduced magnification), which allows for the study of MNP distribution along various tributaries. (D) Computerized tomography image of a portion of the straight lane MIRT tray.
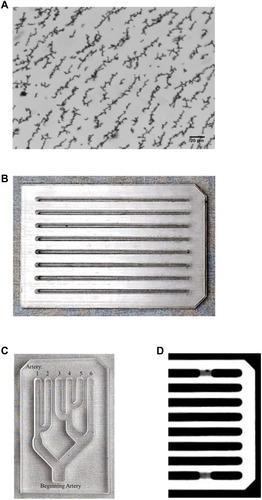
Figure 2 (A) Illustration showing the various positions of the MIRT tray with respect to the rotating magnet (mini-MED), and the direction of MNP travel. “ø” indicates the origin or start position for MNPs. (B) Photograph of the MIRT tray in the offset above position, 20 cm over the mini-MED. The location of the rotating permanent magnet is shown by the arrow. This perspective is rotated 90° and shown from above. The MNPs move remotely (i.e., at a distance from the magnet) due to the rotation of the clusters, and surface traction.
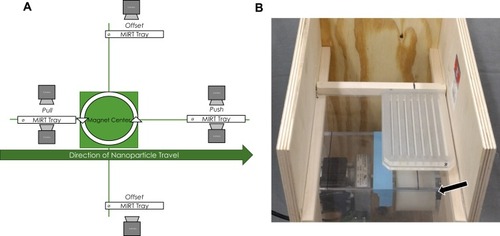
Figure 3 (A) Photograph of MNPs at the starting position (origins) of the straight-laned MIRT tray, in three different fluids, from top to bottom: whole blood, FBS, and DMEM. (B) Photograph of MNPs (with advancing edge at the arrow, in PBS) moving down the tray in response to the action of the mini-MED. (C) Velocity of MNPs in the MIRT tray (y-axis) vs. distance from tray origin (x-axis) for five media (PBS, DMEM, 100% FBS, skim milk, and whole blood) in the 20 cm offset below position (n ≥ 3). (D) Correlation between the viscosity of media (PBS, DMEM, 100% FBS, skim milk, and whole blood) and the average velocity in the 20 cm offset below position.
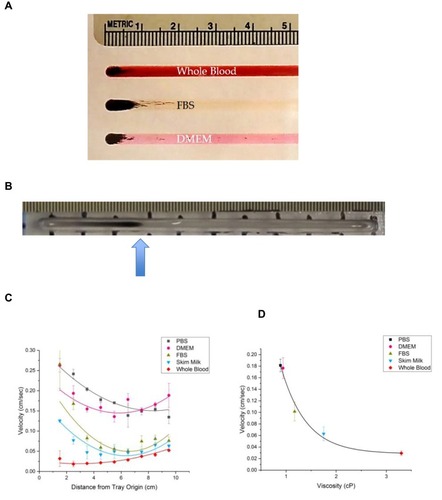
Figure 4 A comparison of MNP velocities in the MIRT tray, traveling through PBS versus unclotted whole blood, using two different tray positions (n = 9). (A) 20 cm offset below position (B). 20 cm pull position. Note that MNPs in the “pull” position in PBS and closest to the magnet have the greatest velocity.
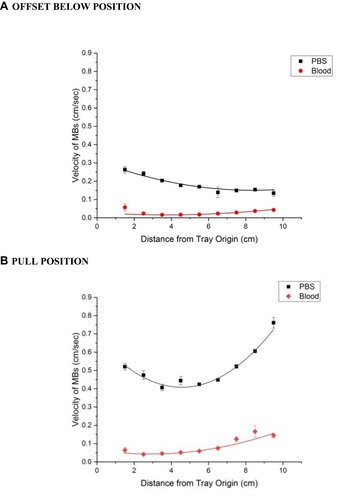
Figure 5 (A) Illustration of branched lane MIRT tray in pull position with rotation at +45, 0, and −45 degrees with respect to the center of the rotating magnet. (B) Relative final concentrations of MNPs after changing the orientation of the branched lane MIRT tray in the pull position (n≥3).
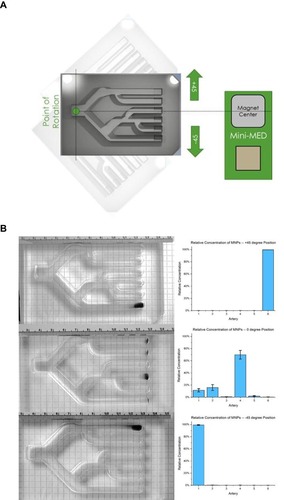
Figure 6 (A) Photomicrograph of rabbit aortic endothelial cells grown in the lanes of the MIRT tray, which were fixed then stained with Hoechst 33342 (blue) for nuclei, and phalloidin (green) for F-actin. (B) Velocity of MNPs in the MIRT tray, through PBS and over rabbit aortic endothelial cells (green), versus in PBS alone without cells (black) in the 20 cm offset above position (n = 6).
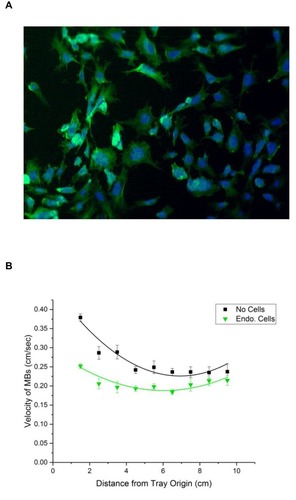
Figure 7 (A) Absorbance spectra of whole blood (red), blood clots (magenta), and blood clots with MNPs (abbreviated for brevity as “MB”) at two concentrations: 2.5 mg/ml (gray) and 25 mg/ml (black). (B) Photographs of untreated and tPA-treated clots after removal from the 96-well plate. (C) Absorbance values (at 640 nm) following clot extraction from the 96-well plate, n≥3. Higher values are seen with more liquid clots. (D) Rate of fibrin clot lysis (mm/hr), in response to different treatments. (E) Rate of whole blood clot lysis (mm/hr), in response to different treatments. For Panels (D and E), n ≥ 5. Significance is indicated as: *, p<0.05 versus blank; **, p<0.0001 versus blank; #, p<0.0001 versus tPA+MNPs+magnet.
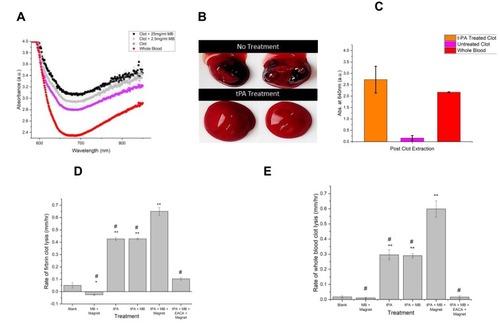
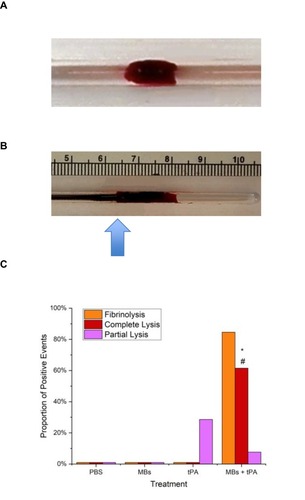
Figure 8 (A) Photograph of a blood clot produced from rabbit whole blood, and then placed within a lane of the MIRT tray. (B) MNPs (arrow) coming into contact with a blood clot, due to the translational effect of the mini-MED. (C) Occurrence of fibrinolysis and partial vs. complete clot lysis in dynamic studies within the straight lane MIRT tray, n≥4. For this assay, fibrinolysis was defined as the appearance of liquid blood and was determined independently of clot lysis. For tPA versus MNPs+tPA: *, p < 0.005. For MNPs versus MNPs+tPA: #, p <0.01.