Figures & data
Figure 1 NMR spectra of (A) PAMAM, (B) PAMAM-PEG, and (C) PAMAM-PEG-APT in D2O at 300 mHz.
Abbreviations: PAMAM, polyamidoamine; PEG, polyethylene glycol; APT, aptamer.
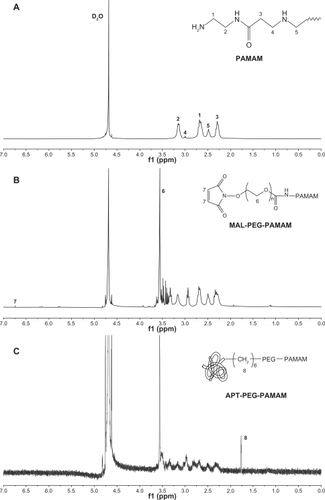
Figure 2 (A) Fluorescence microscopy images (scale bar 50 μm) and (B) fluorescent-activated cell sorting analysis (n = 3, error bars represent a standard deviation) after a 60-minute incubation of DyLight-633-labeled PAMAM-PEG-APT as a function of concentration range against PC3 and LNCaP cells, respectively.
Abbreviations: PAMAM, polyamidoamine; PEG, polyethylene glycol; APT, aptamer.
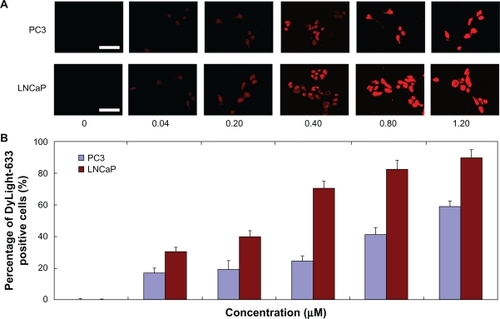
Figure 3 Sizes and zeta potentials of pEGFP/PAMAM-PEG-APT complexes at various N/P ratios.
Abbreviations: PAMAM, polyamidoamine; PEG, polyethylene glycol; APT, aptamer.
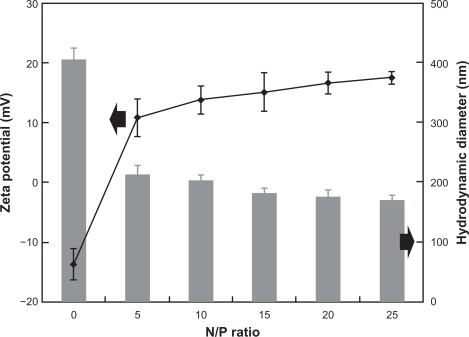
Figure 4 (A) Fluorescence microscopy images (scale bar 50 μm) and (B) luciferase activity analysis (n = 4, error bars represent the standard deviation) after transfection of pGL-3/PAMAM-PEG or pGL-3/PAMAM-PEG-APT as a function of N/P ratios against PC3 and LNCaP cells, respectively. *P < 0.05.
Abbreviations: PAMAM, polyamidoamine; PEG, polyethylene glycol; APT, aptamer.
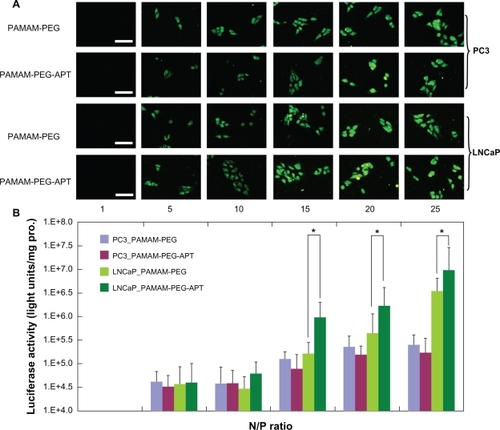
Figure 5 Bcl-2, Cyclin D1, and Wnt3a knock down following miRNA/PAMAM-PEG-APT complexes delivery to LNCaP cells. The cells were treated with miRNA/PAMAM-PEG-APT (miRNA) and NC-miRNA/PAMAM-PEG-APT (NC-miRNA) complexes and processed for immunoblotting with anti-Bcl-2, anti-Cyclin D1, and anti-Wnt3a antibodies at 24, 48, and 72 hours post-transfection. β-actin was a loading control.
Abbreviations: PAMAM, polyamidoamine; PEG, polyethylene glycol; APT, aptamer.
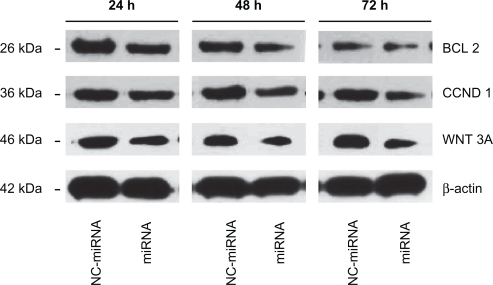
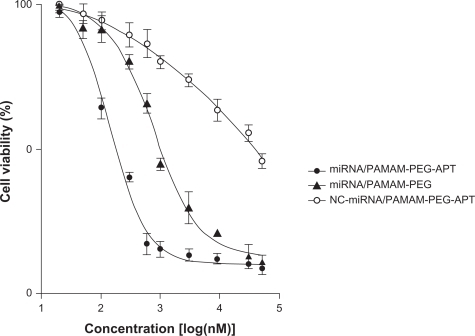
Figure 6 Cell viabilities of LNCaP cells treated with miRNA/PAMAM-PEG-APT, NC-miRNA/PAMAM-PEG-APT, miRNA/PAMAM-PEG complexes, respectively, (n = 3, error bars represent the standard deviation).
Abbreviations: PAMAM, polyamidoamine; PEG, polyethylene glycol; APT, aptamer.