Figures & data
Figure 1 Chemical reactions (left side) and schematic sketches (right side) describing the functionalization of (A) gold nanoparticles with p53 and (B) glass slides with azurin.
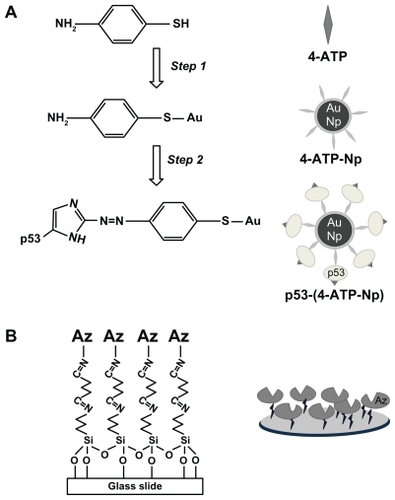
Table 1 Selected Raman and SERS bands of 4-ATP, 4-ATP nanoparticle and p53-4-ATP nanoparticles with their vibrational assignments
Figure 2 Surface-enhanced Raman scattering spectra of water solutions of (A) 4-ATP, (B) 4-ATP self-assembled on 50 nm gold nanoparticles, and (C) p53 conjugated via diazotization to 4-ATP functionalized gold nanoparticles. The spectral range corresponding to the S-H stretching mode is shown in the insets. The measurements were performed by a 633 nm laser line, objective 100× and 50× (no smoothed spectra).
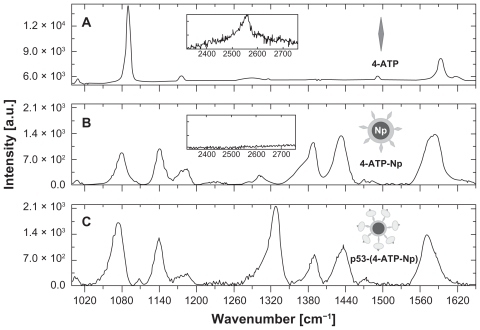
Figure 3 Optical absorption of water solutions of: 50 nm gold nanoparticles (full line), 4-ATP nanoparticles (light dots), and p53-4-ATP nanoparticles (dashed line). The localized plasmon absorption band of the latter is fitted by two components centred at 555 nm and 630 nm (heavy dots).
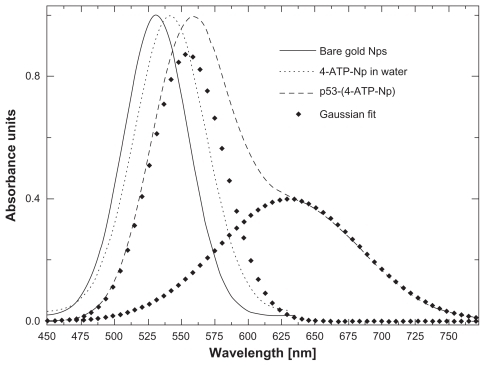
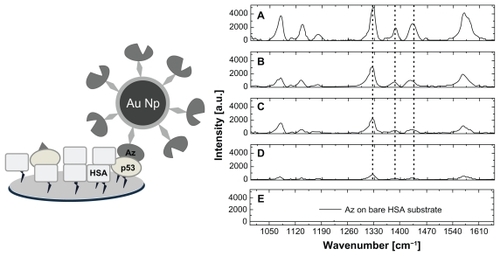
Figure 4 Sketch of a p53-azurin recognition event (left) and surface-enhanced Raman scattering spectra (right) of: the azurin-coated substrate before (A) and after incubation with the p53-4-ATP nanoparticle system, at different p53 concentrations, 5 × 10⁻¹¹ M (B), 5 × 10⁻¹² M (C), and 5 × 10⁻¹³ M (D). Spectra were collected by an objective 100× immersed in phosphate buffer.
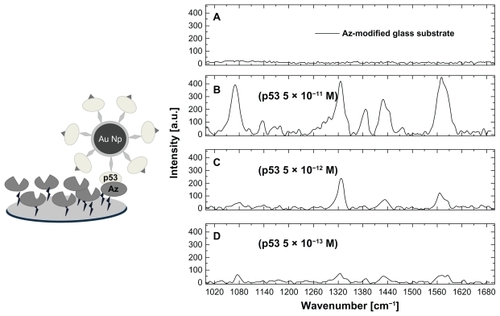
Figure 5 Tapping-mode atomic force microscopy images and vertical section analysis of the azurin-functionalized substrate before (A) and after (B) incubation with a solution 0.5 × 10⁻¹³ M of p53 linked to 50 nm gold nanoparticles. The vertical profile analysis of panel B indicates the presence of single p53 functionalized nanoparticles (height 55 ± 8 nm) recognized by azurin.
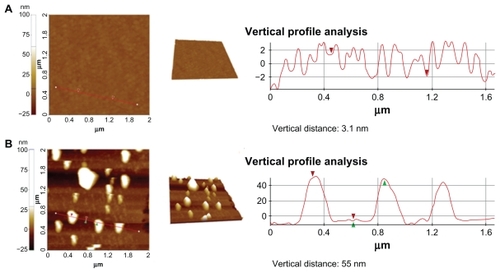
Figure 6 Sketch of an azurin-p53 recognition event in presence of an excess of human serum albumin (left) and surface-enhanced scattering spectra (right) of the capture substrates incubated with the azurin-4-ATP nanoparticle system (5 × 10⁻⁹ M azurin), and previously functionalized with (A) p53 alone, (B) human serum albumin/p53 at molar ratios equal to 10, (C) human serum albumin/p53 at molar ratios equal to 100, (D) human serum albumin/p53 at molar ratios equal to 1000, and (E) human serum albumin alone. Surface-enhanced Raman scattering spectra were acquired with a laser source at 633 nm in air using a 100× objective.