Figures & data
Table 1 Ba/F3 cells incubated in 2 mM gadolinium compared to nontreated cells
Figure 1 Representative image of THP-1 cell treated with 2.0 mM gadolinium shows several vacuoles containing gadolinium oxide nanoparticles and invaginations at the cell surface indicating phagocytic processes (left panel). Illustration of the phagocytic process: (1) nanoparticles in the extracellular fluid, (2) nanoparticles approaching the cell surface, (3) nanoparticles at the cell surface, and (4) nanoparticles internalized in cell vacuole (right panel).
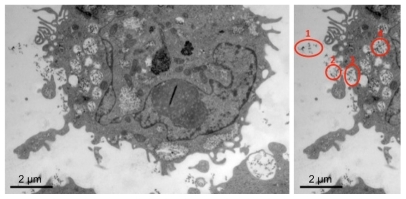
Figure 2 Representative electron microscopy images of cells: THP-1 in (A) and (B); Ba/F3 in (C) and (D). (A) and (C) show gadolinium oxide incubated cells (treated with protamine sulfate and 2.0 mM gadolinium). Gadolinium oxide nanoparticles are visible inside vacuoles of the cell. Images (B) and (D) show control cells not treated at all. These cells do not have as many vacuoles indicating that they were not phagocytically active.
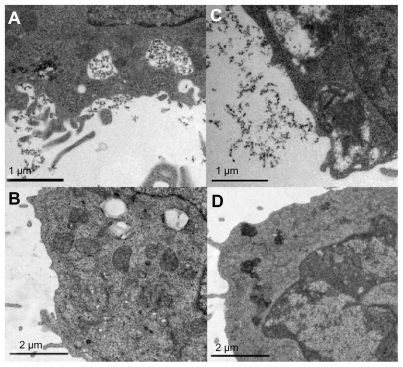
Figure 3 Ba/F3 cells with gadolinium oxide nanoparticles on cell surface. Small endocytic invaginations (see inset) indicate a possible internalization process.
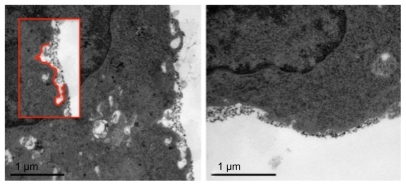
Table 2 Relaxivity values r1 and r2 (s−1 mM−1) at 1.5 T and 21°C for Ba/F3 and THP-1 cell samples incubated with gadolinium oxide nanoparticles with or without protamine sulfate treatment
Figure 4 Relaxation of gadolinium oxide nanoparticles in THP-1 and Ba/F3 cells. Samples were either treated with protamine sulfate or not and the cells were incubated with gadolinium oxide nanoparticles in two different gadolinium concentrations for each sample (0.5 mM or 2.0 mM).
Abbreviations: conc, concentration; Gd, gadolinium.
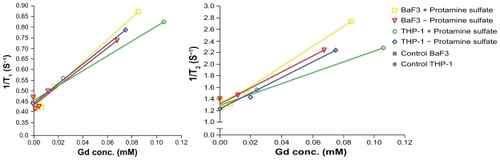
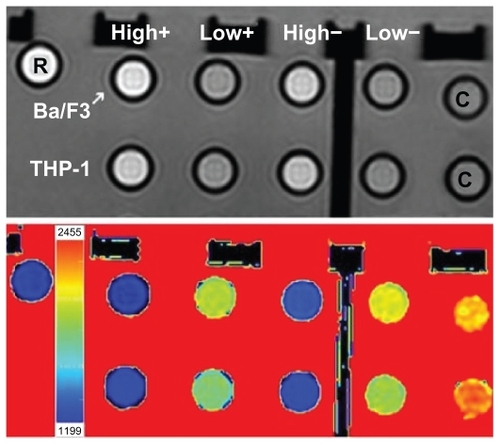
Figure 5 Upper panel shows signal intensity of incubated cell samples (repetition time = 1000 milliseconds, echo time = 20 milliseconds). The first row is Ba/F3 and the second row is THP-1. Columns labeled “high” are treated with 2.0 mM gadolinium and “low” with 0.5 mM gadolinium. Columns labeled with “+” are protamine sulfate treated and with “−” are not treated with protamine sulfate. The rightmost samples (labeled C) are cell control samples with no particles. Sample labeled R is Gd-diethylene triamine pentacetic acid reference (0.1 mM gadolinium in water). Bottom panel shows corresponding T1 map, which shows different colors corresponding to different T1 times.