Figures & data
Figure 1 Mouse with Ehrlich tumor under experiment. Two different laser sources: the blue arrow refers to the superficial green diode laser in the visible region, while the red arrow refers to the interstitial red diode laser in the NIR region.
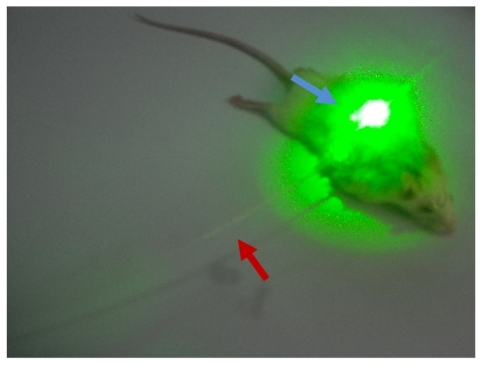
Figure 2 UV-Vis absorption spectra of (A) gold nanosphere and (B) Au@Fe3O4 core–shell nanocomposites. Inset: transmission electron microscope image of gold nanosphere.
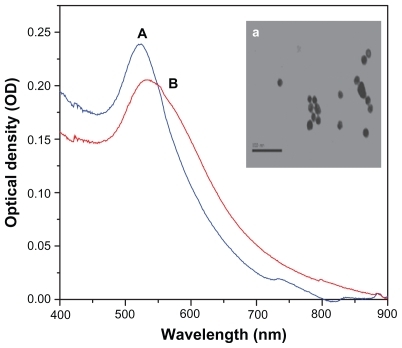
Figure 3 TEM images and XRD patterns of (A) SPIO nanoparticles (Fe3O4), and (B) Au@Fe3O4 core–shell nanocomposites.
Note: The red line represents XRD of SPIO (A), while the blue line represents the core shell (B).
Abbreviations: TEM, transmission electron microscopy; XRD, X-ray diffraction; SPIO, super paramagnetic iron oxide.
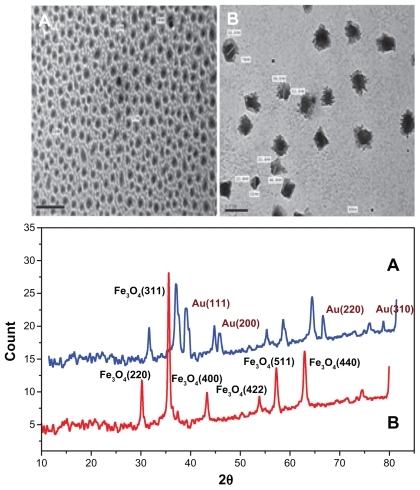
Figure 4 Mean of thermal transient measurements of Ehrlich tumor interstitial during plasmonic photo thermal treatment, using direct injection of Au nanospheres, 1 mL 0.9% PBS and core shell (Au@Fe3O4).
Note: Data reported represents the mean values along the treatment sessions; errors reported as standard deviation.
Abbreviations: PBS, phosphate buffer saline; Au, gold.
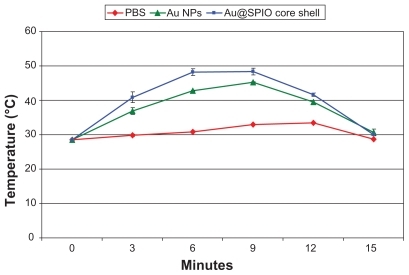
Figure 5 Transmission electron microscope pictures (2.4 μm) of subcutaneous EAC (A) control, (B and C) after injection by core shell NPs and (D–G) after (laser + RF irradiation) one, three, and six sessions of treatments, respectively.
Abbreviations: EAC, Ehrlich ascites carcinoma; NPs, nanoparticles; RF, radio frequency.
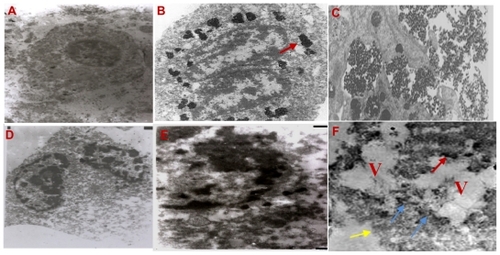
Table 1 Mean value of tumor volume growth of the four groups after 30 days
Figure 6 Efficacy of photo thermal therapy of the groups (laser@PBS, laser@AuNPs and core shell treated one against control).
Note: Data reported in the Figure represents the mean values along the treatment sessions.
Abbreviations: PBS, phosphate buffer saline; AuNPs, gold nanospheres.
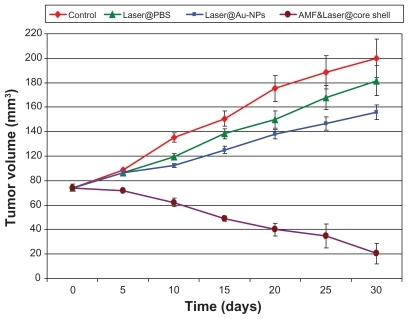
Figure 7 Sagittal T1WI MR images before and after core shell treatment. (A and B) The images revealed loss of signal intensities and complete disappearance of the tumor at the end of the treatment after subjecting to green, NIR, and AMF.
Abbreviations: T1WI, T1 weighted images; MR, magnetic resonance; NIR, near-infrared; AMF, alternative magnetic field.
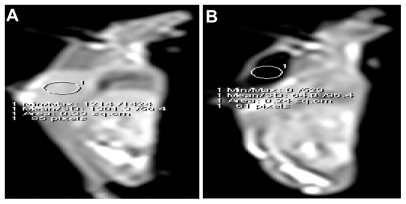
Figure 8 Results of assessment of necrosis in EAC, indicating a significant difference P < 0.05.
Note: Values indicate the mean percentage of necrosis and standard deviations.
Abbreviations: EAC, Ehrlich ascites carcinoma; PBS, phosphate buffer saline; Au- NP, gold nanospheres; AMF, alternative magnetic field; NP, nanoparticles.
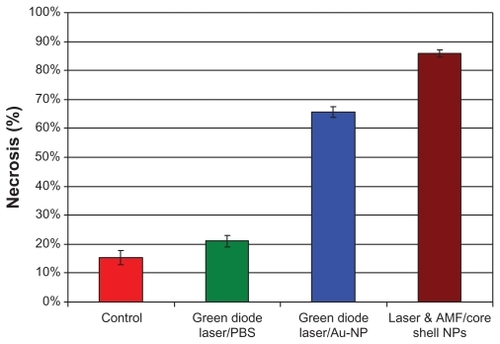
Figure 9 Mice decline in number along the treatment and follow-up period of the control, PBS, gold nanospheres, and core–shell nanoparticles groups.
Abbreviations: PBS, phosphate buffer saline; AMF, alternative magnetic field.
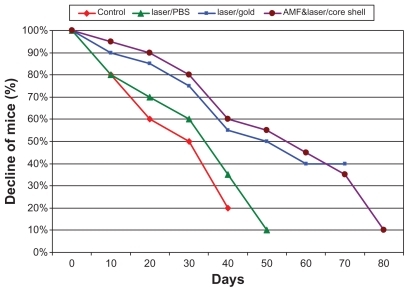
Figure S1 (A) Photographs showing measurement of tumor size in mice by a caliper in two dimensions, ie, vertical and horizontal. (B) Core shell-treated mouse with morphological changes appearing on the tumor surface after being subjected to green diode laser and interstitial near infrared at the same time followed by AMF. Red arrow refers to reduction of height dimension.
Abbreviation: AMF, alternative magnetic field.
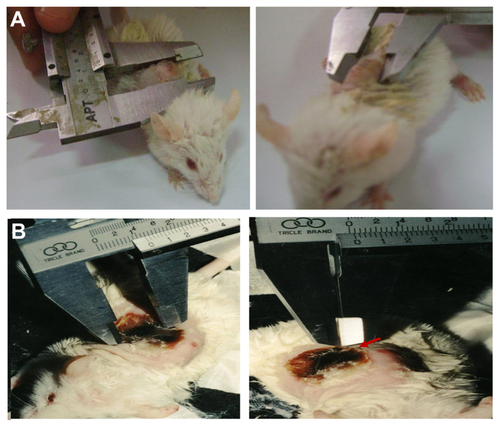
Figure S2 (A) Photograph of mouse with subcutaneous Ehrlich carcinoma tumor injected with colloidal gold nanosphere solution, and subjected to green diode laser. An interstitial probe was inserted into the tumor for measuring interstitial temperature (red arrow). The digital thermometer reading was 34.4°C within the first 2 minutes of exposure. (B) Photograph of mouse with subcutaneous Ehrlich carcinoma tumor injected with gold nanospheres and subjected to green diode laser. An interstitial probe was inserted into the tumor for measuring temperature. Maximum temperature was achieved after 5 minutes of radiation, as shown in inset.
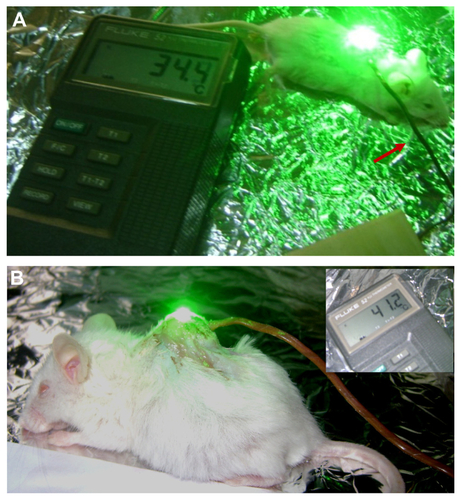
Figure S3 Typical photograph of mouse under magnetic resonance imaging. Red arrow refers to the anesthesia system, black arrow refers to radiofrequency coil.
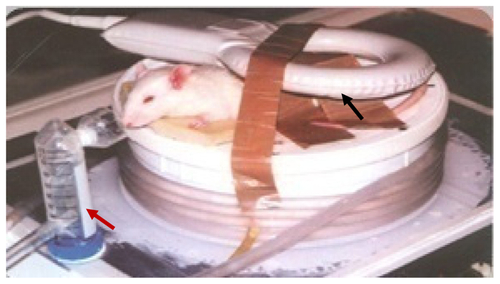
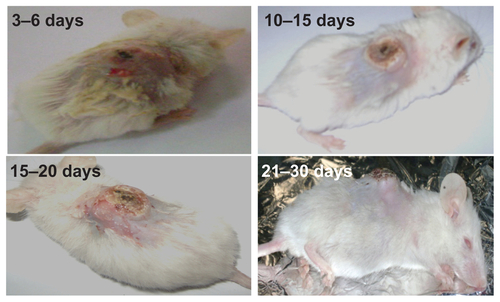
Figure S4 Morphological changes on tumor surface on different treatment days after being exposed to green diode laser and gold nanospheres.