Figures & data
Table 1 Anticancer Properties of Green Synthesized AgNPs
Table 2 DLS Measurements of Nanoparticle Size and Zeta Potential to Compare the Dispersion Characteristics of Particles in Simplified and in vitro Biological Representative Media
Figure 1 (A) TEM image of green silver nanoparticles (gAgNPs) (B) Distribution green silver nanoparticles (gAgNPs) size (%).
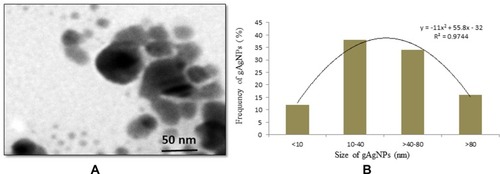
Figure 2 Cytotoxicity of gAgNPs on CHANG and HuH-7 cells for 24 hrs, as evaluated by (A). MTT (B). LDH assays. Each value represents the mean ±SE of three experiments. n= 3, *p < 0.05, ** p < 0.01 vs control.
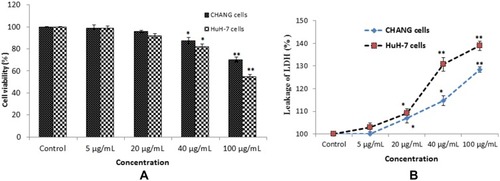
Figure 3 DCF Fluorescence intensity of CHANG and HuH-7 cells after exposure to NPs for 24 hr (A) Control CHANG cells (B) CHANG cells at 40 µg/mL gAgNPs exposure (C) CHANG cells at 100 µg/mL gAgNPs exposure (D) Control HuH-7 cells (E) HuH-7 cells at 40 µg/mL gAgNPs exposure (F) HuH-7 cells at 100 µg/mL gAgNPs exposure (G) % ROS generation due to NPs exposure to cells. Each value represents the mean ±SE of three experiments. *p< 0.05 and **p< 0.01vs. control. Scale bar is 200 µm.
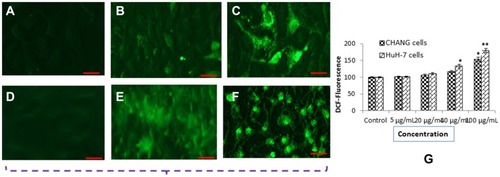
Figure 4 After exposure of gAgNPs on CHANG and HuH-7 cells for 24 hrs (A). Levels of LPO (B). GSH in cells. Each value represents the mean ±SE of three experiments. *p < 0.05 and**p < 0.01 vs control.
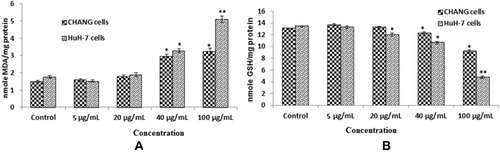
Figure 5 Photomicrograph of JC-1 fluorescence intensity in CHANG cells (A) and HuH-7 cells (B) after exposure to gAgNPs (C). JC-1 fluorescence ratio as marker of MTP loss. Each value represents the mean ±SE of three experiments. *p < 0.05 and **p < 0.01 vs control. Scale bar is 20 µm.
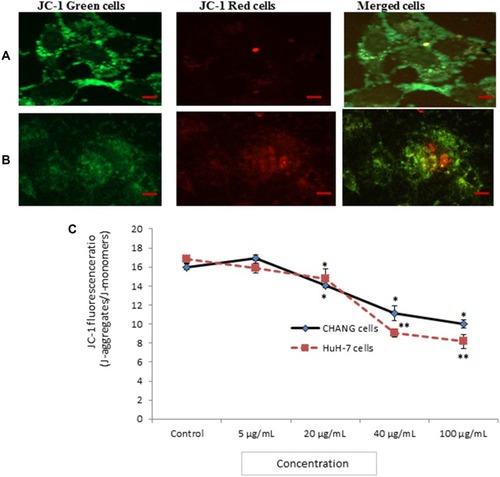
Figure 6 Chromosomal condensation (A). Control CHANG cells (B). CHANG cells exposed at 20 µg/mL gAgNPs (C). CHANG cells exposed at 40 µg/mL gAgNPs (D). Control HuH-7 cells (E). HuH-7 cells exposed at 20 µg/mL gAgNPs (F). HuH-7 cells exposed at 40 µg/mL gAgNPs and (G) Induction of caspase-3 activity in CHANG and HuH-7 cells after exposure to gAgNPs for 24 hrs. Each value represents the mean ±SE of three experiments. *p < 0.05 and **p < 0.01 vs control. Arrow indicates fragmented chromosome. Scale bar is 200 µm.
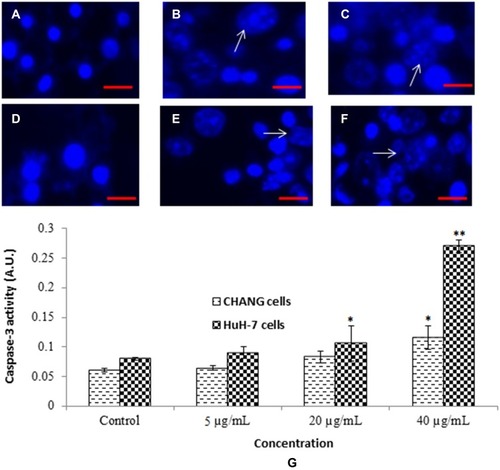
Figure 7 The fluorescence scatter diagram after exposure to gAgNPs (40 µg/mL) to cells (A). Control CHANG cells (B). CHANG cells exposed at 40 µg/mL gAgNPs (C). Control HuH-7 cells (D). HuH-7 cells exposed at 40 µg/mL gAgNPs and (E) Induction of early and late apoptotic cells (%) after exposure to gAgNPs (40 µg/mL) for 24 hrs. Each value represents the mean ±SE of three experiments. *p < 0.05 vs control. FL-1 Height and FL-2 Height represents Annexin-V-FITC and PI staining cells, respectively. LL – living cells (Annexin-V–/PI–stained), LR – Early apoptotic cells (Annexin-V+/PI–stained), UL – Necrotic cells (Annexin-V–/PI+ stained), UL – Late apoptotic cells (Annexin-V+ PI+ stained).
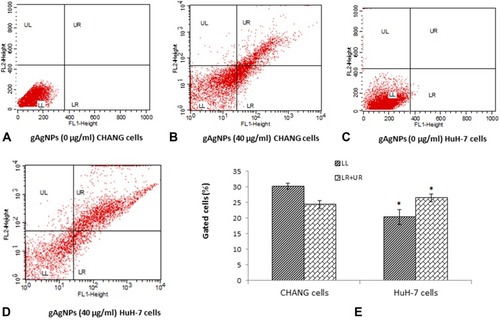
Figure 8 Genotoxic effect of gAgNPs exposure to CHANG and HuH-7 cells (A). Tail DNA (%) (B). Olive tail moment. DNA damage photomicrograph of cells due to gAgNPs exposure (C). Control CHANG cells (D). CHANG cells exposed at 40 µg/mL gAgNPs (E). Control HuH-7 cells (F). HuH-7 cells exposed at 40 µg/mL gAgNPs. Each value represents the mean ±SE of three experiments. *p < 0.05 and **p < 0.01 vs control. Scale bar is 50 µm.
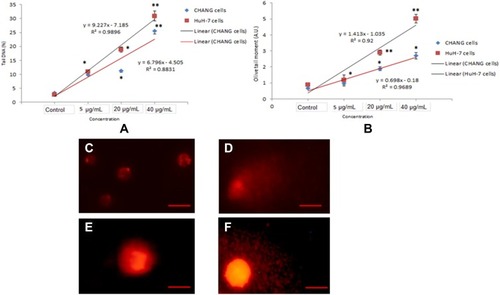
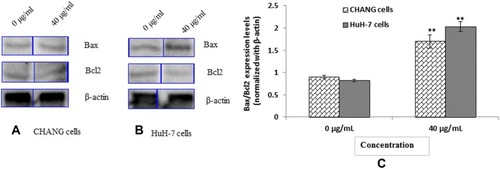
Figure 9 Expression of pro and anti-apoptotic proteins as evaluated by immuno blotting for 24 hrs (A) CHANG cells (B) HuH-7 Cells (C) Densitometry analysis of relative protein level of Bax/Bcl2 ratio. Each value represents the mean ±SE of three experiments. n= 3, ** p < 0.01 vs control.