Figures & data
Figure 1 The combination of biotin-graft-poly(lactic acid) nanoparticles with streptavidin and with biotinylated protein via a streptavidin arm to realize targeted drug delivery.
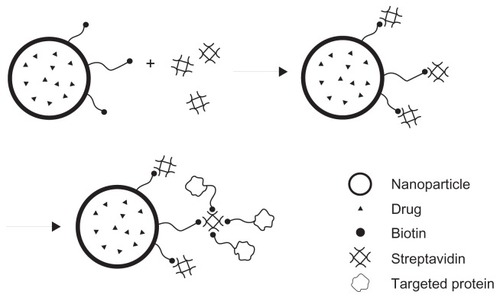
Figure 2 Critical micelle concentration (CMC) determination of biotin-graft-poly(lactic acid) (PLA). (A) Excitation spectra of pyrene from 300–360 nm as a function of biotin-graft-PLA concentration in water. (B) Intensity ratio (328/326) of pyrene versus logarithm concentration of poly(ethylene glycol)-graft-PLA. CMC was 7.1 × 10⁻⁴ mg/mL, determined by taking the midpoint in the plot of (B).
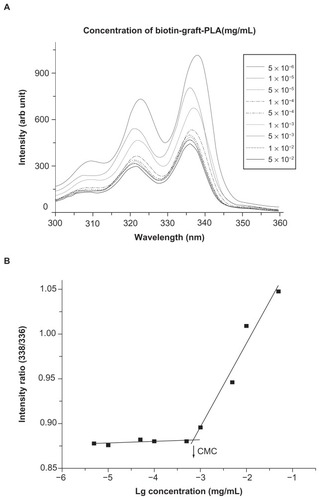
Figure 3 Spherical morphology of native (A) and naproxen-loaded biotin-graft-poly (lactic acid) nanoparticles (B) observed via transmission electron microscope. Scale bar was 200 nm.
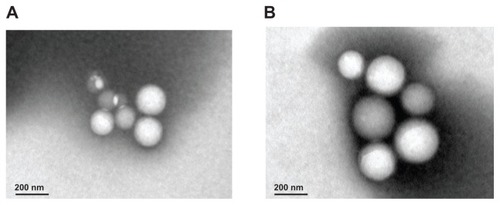
Figure 4 Particle size (PS; top figures), polydispersity (the value above the column on the top figures), and zeta potential (ZP; bottom figures) of naproxen-loaded biotin-graft-poly(lactic acid) nanoparticles (NPs) with/without dilution and pH changes, tested by dynamic light scatter (Zetasizer Nano S90; Malvern Instruments Ltd, Malvern, UK).
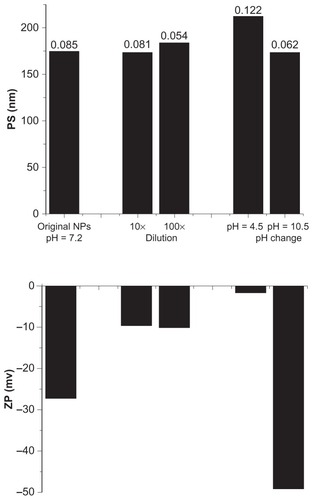
Figure 5 Typical in vitro naproxen release profile from nanoparticles of biotin-graft- poly(lactic acid) (time in hours).
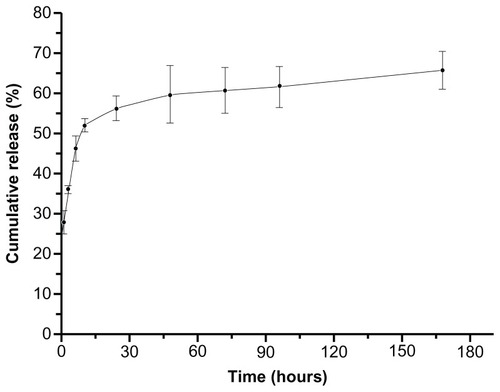
Figure 6 The binding of biotin-graft-poly(lactic acid) (BPLA) and poly(ethylene glycol)-graft-poly(lactic acid) (PPLA) nanoparticles (NPs) on streptavidin and of streptavidin-incubated BPLA NPs (BPLA NPs-S) and streptavidin-incubated PPLA NPs (PPLA NPs-S) on biotin under static and dynamic condition.
Note: *Indicates P < 0.05 compared with PPLA NPs or PPLA NPs-S.
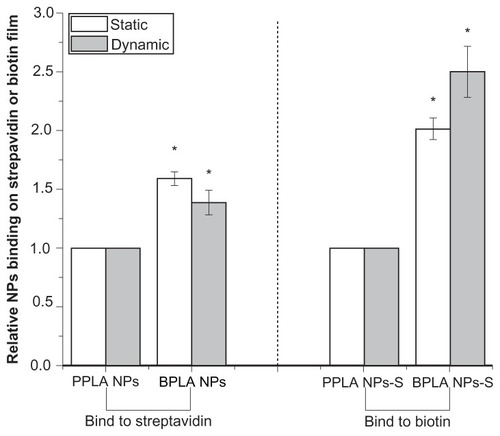
Figure S1 Differential scanning calorimetry curves of biotin-graft-poly(lactic acid) (A) and poly(ethylene glycol)-graft-poly(lactic acid) (B).
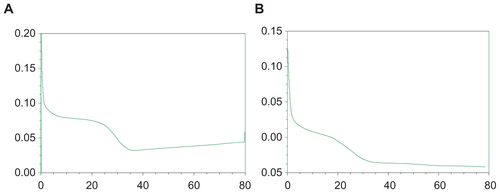
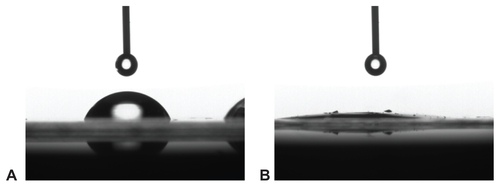
Figure S2 The contact angle comparison of biotin-graft-poly(lactic acid) (A) and poly(ethylene glycol)-graft-poly(lactic acid) (B).