Figures & data
Figure 1 (A) Powder diffraction pattern of a zeolite membrane grown on an alumina support (the strongest peaks marked with an asterisk are due to the alumina, the rest are zeolite peaks. (B) Cross-section of the zeolite/alumina membrane by scanning electron microscopy.
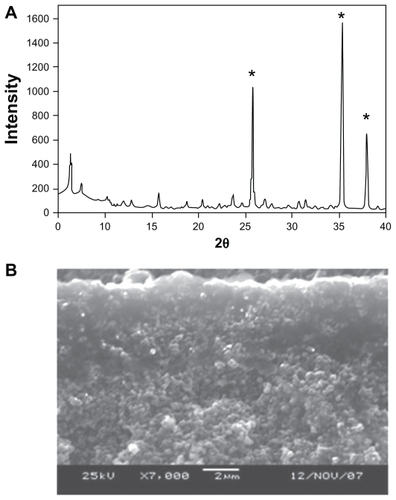
Figure 2 (A) Top view of the zeolite part of the silver-loaded zeolite/alumina membrane by scanning electron microscopy. (B) Magnified image of the top view of A showing discrete Ag particles on the zeolite. (C) Elemental analysis of the silver nanoparticles embedded in zeolite membranes, showing the presence of Ag, Si, and Al.
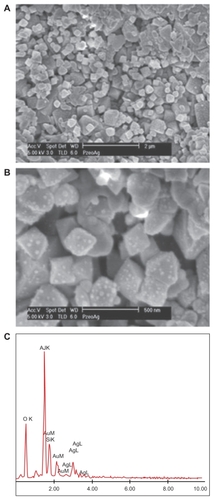
Figure 3 (A) Turbidity analyses of supernatant samples from unexposed Escherichia coli and E. coli exposed to zeolite controls or zeolite-supported silver nanoparticles over time. Values are expressed as the mean and standard deviation of two experiments. (B) Enumeration of viable E. coli over time upon incubation with zeolite supports containing silver nanoparticles and controls.
Notes: *Significant differences versus zeolite membrane controls, n = 3, freshly-prepared zeolite supports containing silver nanoparticles, P < 0.05.
Abbreviation: cfu/mL, colony forming units per milliliter.
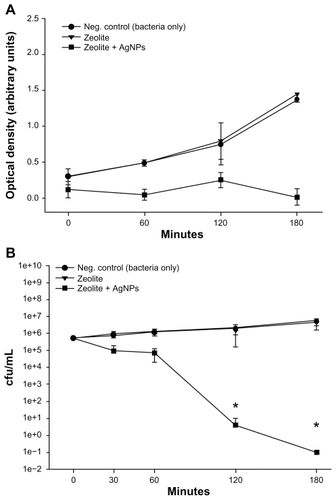
Figure 4 (A) Viability of Escherichia coli after exposure to supernatants collected from two zeolite supports containing silver nanoparticles and zeolite controls that were soaked in Luria Bertani media for three hours. (B) Viability of E. coli after exposure to two zeolite supports containing silver nanoparticles that were separated from bacteria using transwell plates. Zeolite supports containing silver nanoparticles are listed as zeolite + silver nanoparticle support 1 and support 2 in the Figure.
Abbreviation: cfu/mL, colony forming units per milliliter.
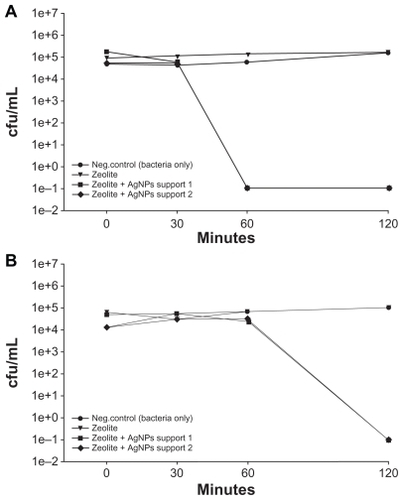
Figure 5 Escherichia coli at a concentration of 1 × 10⁶ cfu/mL was incubated with the same zeolite supports containing silver nanoparticles six consecutive times, with autoclave sterilization between each use. Bacterial viability was determined using plate counts.
Abbreviation: cfu/mL, colony forming units per milliliter.
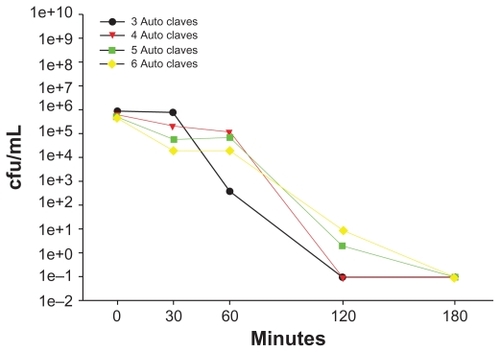
Table 1 Increases in Escherichia coli gene expression in response to 30-minute exposures to four independent zeolite supports containing silver nanoparticles versus E. coli exposed to four independent zeolite controls
Table 2 Decreases in Escherichia coli gene expression in response to 30-minute exposures to four independent zeolite supports containing silver nanoparticles versus E. coli exposed to four independent zeolite controls
Table 3 Quantitative reverse transcriptase polymerase chain reaction analyses of select genes after three independent trials of zeolite support-containing silver nanoparticles. Escherichia coli at a concentration of 1 × 10⁸ colony forming units/mL was exposed to silver nanoparticles embedded in zeolite membranes or zeolite membrane controls for 45 minutes prior to RNA isolation and analyses. Values are fold-change ± standard deviation
Figure 6 Growth and viability of Staphylococcus aureus alone, exposed to a zeolite membrane, or exposed to zeolite supports containing silver nanoparticles was evaluated over time. (A) Turbidity was analyzed after 30, 60, 120 or 180 minutes of exposure to a single zeolite support containing silver nanoparticles. (B) Bacterial viability was measured after 30, 60, 120, and 180 minutes of exposure to a single zeolite support containing silver nanoparticles.
Abbreviation: cfu/mL, colony forming units per milliliter.
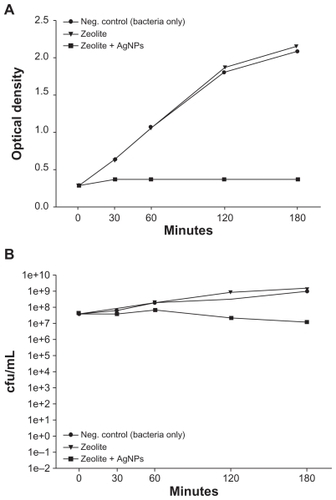
Figure S1 Schematic of fabrication of zeolite support containing silver nanoparticles. Alumina supports were used as the substrate for zeolite membrane synthesis. Zeolite was grown into a continuous membrane by hydrothermal synthesis. Zeolite membranes were then ion-exchanged with 0.005 M AgNOCitation3 solution, washed, and then reduced by hydrazine.
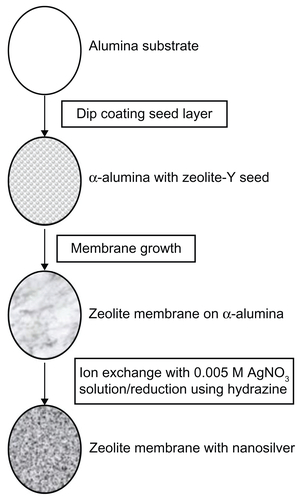
Figure S2 Viability of Escherichia coli after exposure to zeolite support containing silver nanoparticles for 30 minutes. The viability of E. coli was determined after exposure to zeolite support containing silver nanoparticles for 30 minutes. RNA was harvested from these experiments and used for the gene expression microarray analyses. Viability was significantly reduced after incubation with zeolite support containing silver nanoparticles for 30 minutes, compared with zeolite controls. Statistical significance was determined using the Student’s t-test (n = 4 for zeolite controls and zeolite support containing silver nanoparticles, P < 0.02).
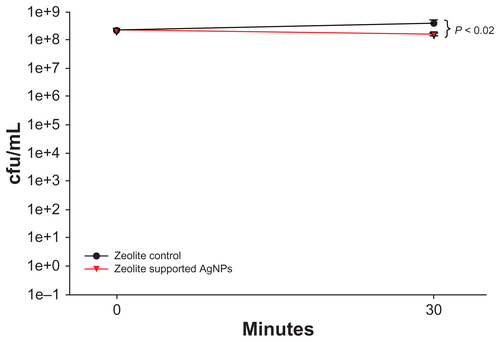
Table S1 E. coli primer sequences for quantitative real-time PCR (QRT-PCR)
Table S2 Increases in E. coli gene expression in response to 30-minute exposures to four independent zeolite supports containing AgNPs versus E. coli exposed to four independent zeolite controls
Table S3 Decreases in Escherichia coli gene expression in response to 30-minute exposures to four independent zeolite supports containing silver nanoparticles versus E. coli exposed to four independent zeolite controls