Figures & data
Figure 1 Ultraviolet-visible spectra of Au-2-BNQ, Au-2,3-DBNQ, and Au-PAM-PB nanoconjugates. Using different concentrations of conjugates (10 μg/mL of AuNP solution), an increase in absorbance of (A) Au-2-BNQ at 350 nm and (B) Au-2,3-DBNQ at 360 nm is observed with increasing concentrations of 2-BNQ (10, 20, 30, and 50 μg/mL) and 2,3-DBNQ (10, 15, 20, 25 and 30 μg/mL), respectively, up to 20 μg/mL is seen, and then a decrease. Absorbance increases up to 20 μg/mL and then the absorbance decreases with increasing concentrations of both 2-BNQ and 2,3-DBNQ. (C) Similarly, imilarly, for Au-PAM-PB (5, 10, 15, 20, 30, 40, and 50 μg/mL), the absorbance at 420 nm increases to a maximum at 30 μg/mL and then decreases with an increase in concentration of plumbagin. All experiments were performed three times with similar results.
Abbreviations: Au, gold; 2-BNQ, 2-bromo-1,4-naphthoquinone; 2,3-DBNQ, 2,3-dibromo-1,4-naphthoquinone; PB, plumbagin; PAM, polyethylene glycol-amine.
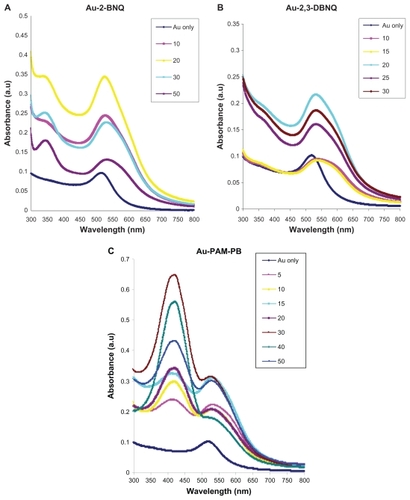
Figure 2 Ultraviolet-visible spectral readings of AuNP and nanoconjugates indicating the change in peak of wavelength (shift in λmax) of gold nanoparticles with increasing concentrations of (A) 2-BNQ, (B) 2,3-DBNQ, and (C) Au-PAM-PB. A predicted schematic diagram of Au-PAM-PB complex is shown in (D). Au-PAM may conjugate with plumbagin by amide bonding.
Abbreviations: Au, gold; 2-BNQ, 2-bromo-1,4-naphthoquinone; 2,3-DBNQ, 2,3-dibromo-1,4-naphthoquinone; PB, plumbagin; PAM, polyethylene glycol-diamine.
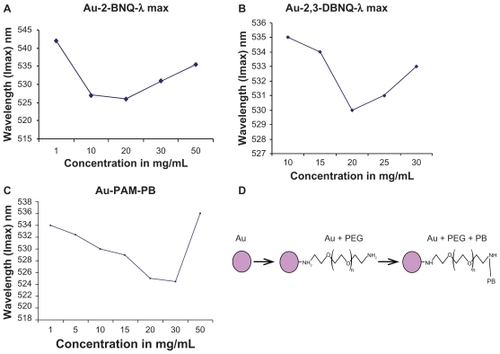
Figure 3 Release profiles for plumbagin from Au-PAM-PB nanoconjugates. There was a constant release of plumbagin from Au-PAM-PB for up to six hours in phosphate-buffered solution at pH 7.4.
Abbreviations: Au, gold; PB, plumbagin; PAM, polyethylene glycol-amine.
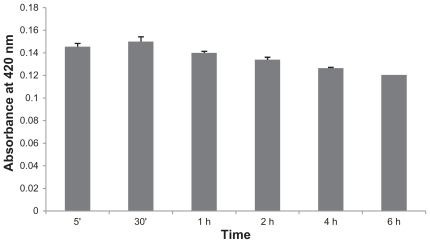
Figure 4 (A) MTS cell proliferation assay with naphthoquinones in MDA-MB-231 cells. Concentrations of all free compounds and compounds with AuNP conjugates were constant (100 nM) as indicated. The concentration was calculated from the standard curve drawn using the absorbance obtained at 420, 350, and 360 nm for plumbagin, 2-BNQ, and 2,3-DBNQ, respectively. MTS reading was taken after 48 hours of incubation with the compounds and AuNP conjugates. (B) Thymidine incorporation assay also showed fewer S phase cells in those treated with the pristine compound compared than the AuNP conjugates. The experiment was repeated at least three times, with similar results.
Abbreviations: Au, gold; 2-BNQ, 2-bromo-1,4-naphthoquinone; 2,3-DBNQ, 2,3-dibromo-1,4-naphthoquinone; PB, plumbagin; NP, nanoparticles.
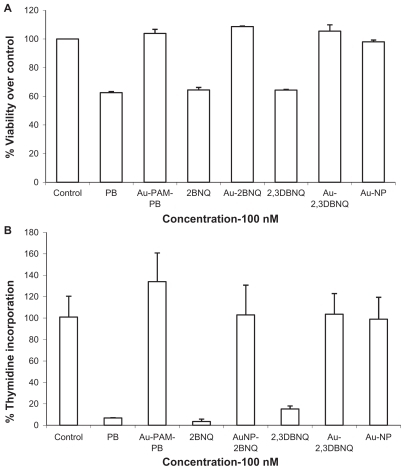
Figure 5 Cells were counted after Annexin-propidium iodide staining. Cells with bound Annexin V show green staining in the plasma membrane. Cells that have lost membrane integrity show red staining (propidium iodide) throughout the cytoplasm. Flow cytometric analysis showed live (no stain), early apoptotic cells (only annexin staining), late apoptotic cells (both annexin and propidium iodide staining), and dead (propidium iodide staining) cells. Most of the plumbagin-treated cells were in the late apoptotic stage, whereas the AuNP conjugates had fewer numbers of late apoptotic cells. More live cells are observed in AuNP conjugates than in samples treated with the pristine compound. A t-test showed a statistically significant difference between the percentage of late apoptotic cells induced by plumbagin versus Au-PAM-PB and 2,3-DBNQ versus Au-2,3-DBNQ. The experiment was repeated at least three times with similar results.
Abbreviations: Au, gold; 2-BNQ, 2-bromo-1,4-naphthoquinone; 2,3-DBNQ, 2,3-dibromo-1,4-naphthoquinone; PB, plumbagin; PAM, polyethylene glycol-amine; NP, nanoparticles.
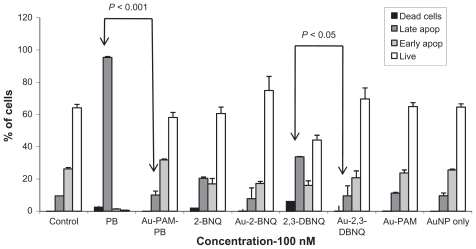
Figure 6 Western blot analysis of p53 protein expression showed that only plumbagin-treated cells had reduced expression of p53 at 100 nM concentration.
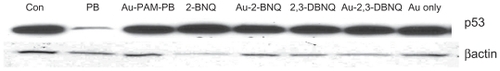
Figure 7 Cellular uptake of Au-PAM-PB. Transmission electron microscopic analysis of MDA-MB-231 cells treated with Au-PAM-PB 100 nM for 24 hours showed internalization of Au-PAM-PB by lysosomes in the cells. Magnifications of the figures shown as (A) 6000×, (B) 20,000×, and (C) 80,000×. The experiment was repeated at least three times with similar results.
Abbreviations: Au, gold; PB, plumbagin; PAM, polyethylene glycol-amine.
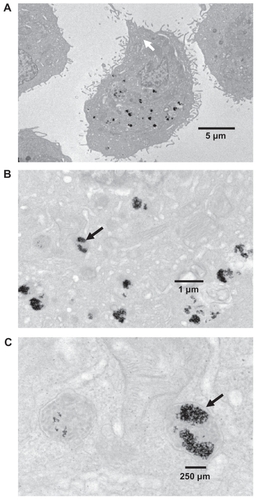
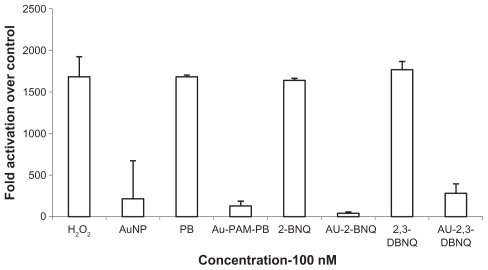
Figure 8 Reactive oxygen species generation study with DCFH-DAH2 staining. H2O2 production was detected using nonfluorescent DCFH-DAH2 dye, which when oxidized is converted into fluorescent 2′,7′-dichlorofluorescein (excitation 488 nm, emission 540 nm). The AuNP conjugates and AuNP alone could not induce reactive oxygen species production, while the positive control (10 μM H2O2) and the pristine compounds generated reactive oxygen species. The experiment was repeated at least three times with similar results.
Abbreviations: Au, gold; NP, nanoparticles.