Figures & data
Figure 1 EGFR expression on breast cancer cells by quantum dot-immunohistochemistry and immunohistochemistry. EGFR-positive expression on breast cancer cells imaged under Olympus DP72 camera (400×) by quantum dot-immunohistochemistry (A) and immunohistochemistry (B), control group (rabbit IgG) showed no any positive expression on breast cancer cells by quantum dot-immunohistochemistry (C), and immunohistochemistry (D). Scale bar: 25 μm for (A, B, C, and D).
Abbreviation: EGFR, epidermal growth factor receptor.
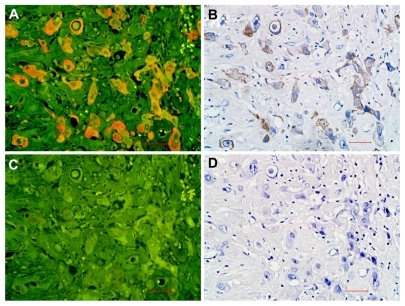
Figure 2 EGFR determination and quantitative analysis. EGFR positive expression (A) and EGFR-negative expression (B) imaged under DP72 camera (40×); EGFR signal distribution (C) and EGFR signal locating (D) in the core (40×) unmixed by the Nuance multispectral imaging system; EGFR-positive expression imaged under DP72 camera (200×) (E), EGFR signal analysis by Nuance multispectral imaging systems (F), EGFR positive expression (G) and negative control group (H) imaged under DP72 camera (400×). Scale bar: 250 μm for (A–D), 50 μm for (E), 25 μm for (G and H).
Abbreviation: EGFR, epidermal growth factor receptor.
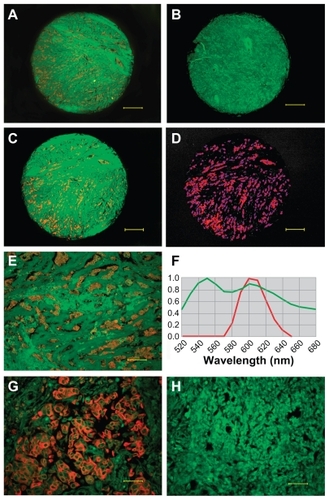
Table 1 Main clinicopathological features and EGFR area of 240 patients with breast cancer
Figure 3 Receiver-operating characteristic analysis of EGFR area by five-year recurrent status of 240 cases (A) and the five-year recurrence-free survival of patients with different EGFR area (B).
Abbreviation: EGFR, epidermal growth factor receptor.
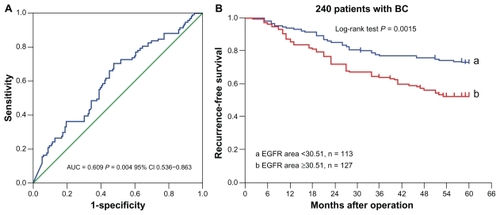
Table 2 Factors correlated with five-year recurrence-free survival of patients with breast cancer
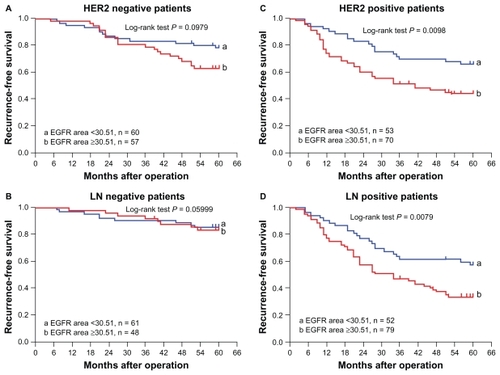
Figure 4 The EGFR area and five-year recurrence-free survival in HER2 and lymph node subgroups.
Abbreviations: EGFR, epidermal growth factor receptor; LN, lymph node.