Figures & data
Figure 1 Schematic showing that the self-assembly of GO, nHA and AgNO3 to form a porous AHRG scaffold.
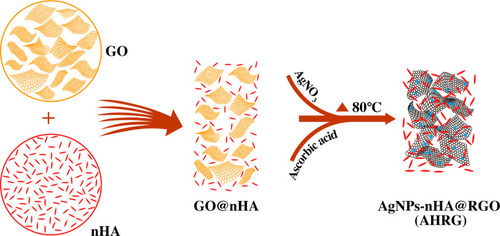
Figure 2 SEM analysis of the AgNPs-nHA@RGO (AHRG) scaffold with the different AgNPs loading ratios.
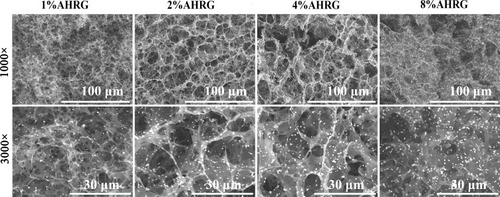
Table 1 Silver Ion Concentration Before and After Self-Assembly
Figure 3 Physicochemical characterization of AHRG scaffolds, (A) High-resolution transmission electron microscopy, (B) Selected area electron diffraction, (C) X-ray photoelectron spectroscopy, (D) compressive modulus of each set of scaffolds, (E) Porosity of each set of scaffolds.
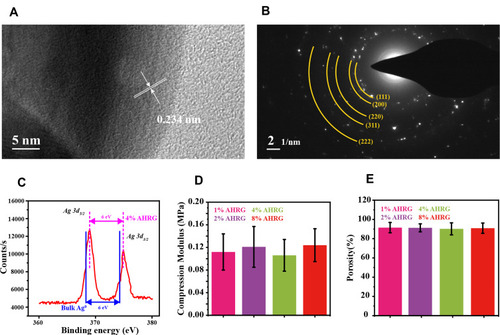
Figure 4 EDS mapping of the cross section of the scaffold.
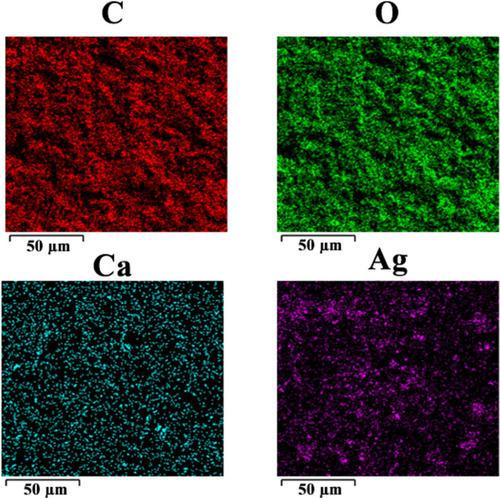
Figure 5 Antibacterial curve of different nano-silver loading AHRG scaffolds, (A) 1% AHRG, (B) 2% AHRG, (C) 4% AHRG, (D) 8% AHRG.
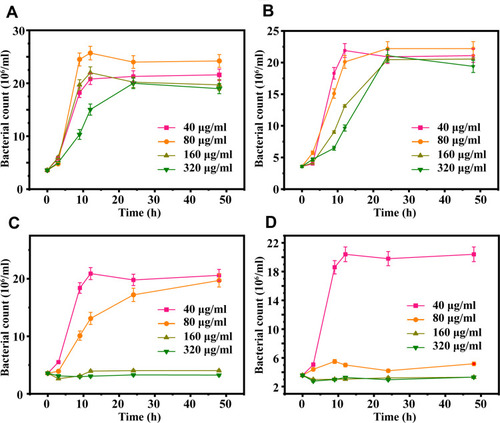
Figure 6 Kirby-Bauer diffusion test of different nano-silver loading AHRG scaffolds, (A) Original untreated AHRG scaffold, (B) Scaffold soaked in PBS for 7 days, (C) Scaffold soaked in PBS for 14 days, and (D) Statistical graphs of inhibition zone diameters for each AHRG scaffold. Label a, b, c, and d represent 1%, 2%, 4%, and 8% AHRG scaffolds, respectively. **p <0.01.
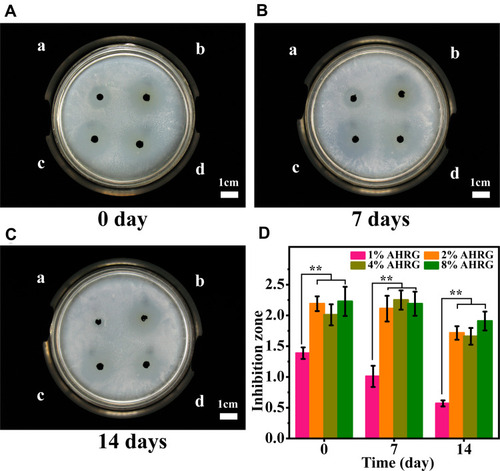
Figure 7 Growth of MRSA biofilm after treatment with different AHRG scaffold. *p <0.05, **p <0.01.
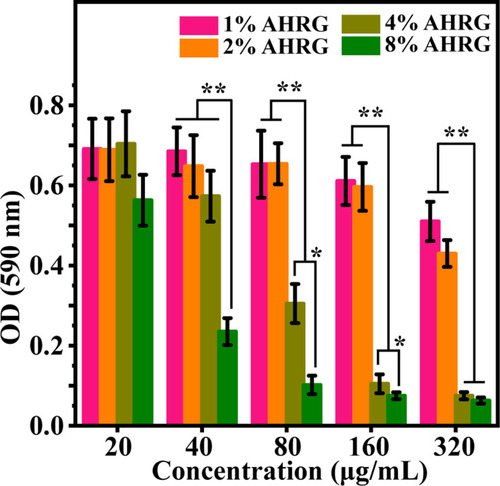
Figure 8 Cell biocompatibility of different AHRG scaffolds, (A) Day 1 of CCK-8 test, (B) Day 3 of CCK-8 test, (C) Day 1 of LDH test, (D) Day 3 of LDH test. **p <0.01.
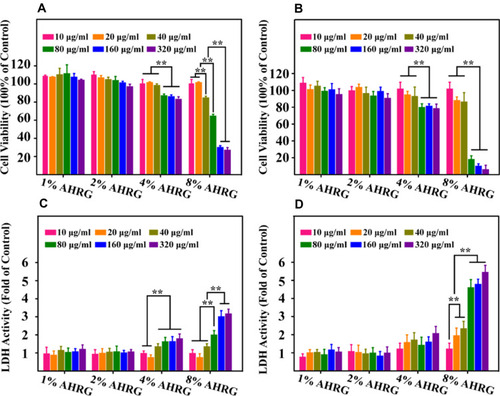
Figure 9 Changes in WBC, CRP, and body weight in rabbits after bacterial injection and material implantation. (A) WBC curve, (B) CRP curve, (C) Body weight curve. The entire experiment was carried out for 70 days. From day 10, the AHRG material was implanted for treatment.
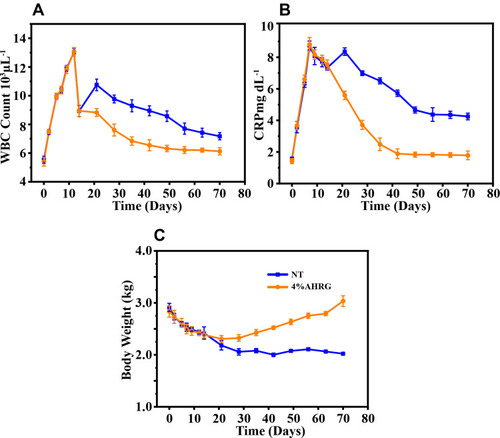
Figure 10 Bone morphology examination of defect repair at different time points after implantation of AHRG material. (A) Micro CT 3D reconstruction image of the defect site, corresponding (B) Bone volume, and (C) Bone density data statistics. **p <0.01.
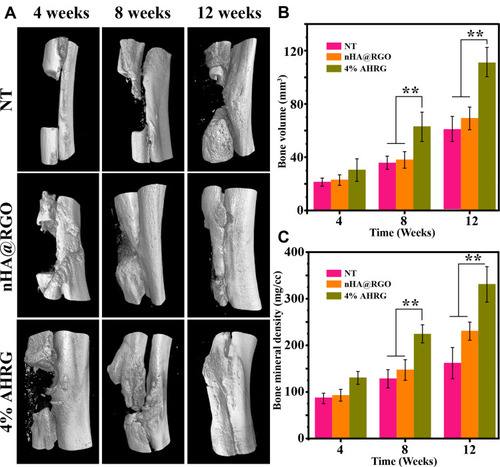
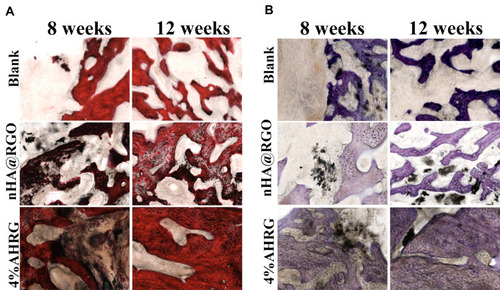
Figure 11 Histological analysis of the defect sites in different experimental groups at different time points: (A) HE staining, (B) TB staining.