Figures & data
Figure 1 Solubilities of HST in DENA solutions at 20°C. Arrow indicates a sufficient solubility of HST to maintain the sink conditions in the receptor phase of the skin permeation study.
Note: Values represent mean ± standard deviation, n = 3.Citation34
Abbreviations: HST, hirsutenone; DENA, N,N-diethylnicotinamide.
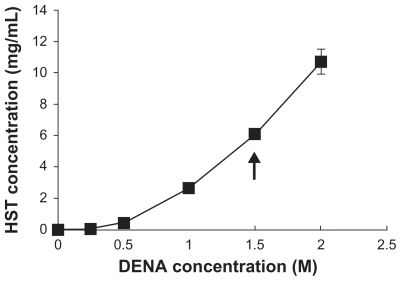
Table 1 Permeation parameters of HST in various formulations through depilated mouse skin (mean ± standard deviation, n = 3)
Figure 2 Permeation profiles of HST in various formulations through depilated mouse skin for 24 hours.
Note: Values represent mean ± standard deviation, n = 3.Citation34
Abbreviations: CC, conventional cream; CC/T, Tat-admixed conventional cream; EL, elastic liposomes; EL/T, Tat peptide-admixed elastic liposomes.
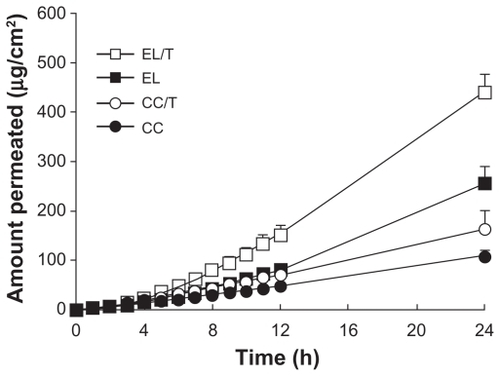
Figure 3 Comparison of formulation effects on skin permeation of HST based on two variables of EL formulation and Tat peptide addition. Enhancement ratio was expressed as a relative ratio of the flux values.
Note: Data are expressed as mean ± standard deviation, n = 3.Citation34
Abbreviations: CC, conventional cream; EL, elastic liposomes; EL/T, Tat peptide- admixed elastic liposomes; HST, hirsutenone.
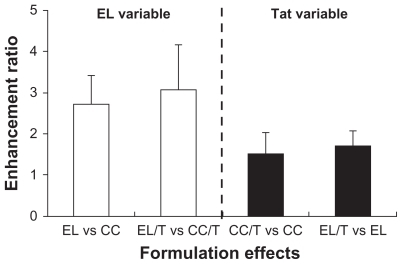
Figure 4 Clinical observations of atopic dermatitis-like skin lesions in NC/Nga mice after topical administration of various formulations: drug-free cream base (control), Tat-admixed conventional cream (CC/T), and Tat-admixed elastic liposomes (EL/T).Citation34
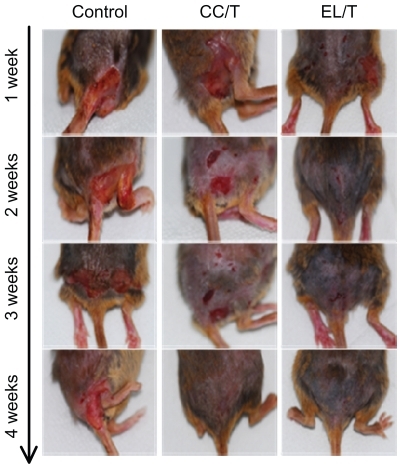
Figure 5 Changes in skin severity score after topical application of HST formulations: control, CC/T and EL/T. A total score for skin severity was defined as the sum of the individual scores, graded as 0 (none), 1 (mild), 2 (moderate), and 3 (severe), for each sign and symptom, such as erythema, edema, oozing or crust, excoriation, lichenification and dryness.
Notes: Bar represents standard deviation (n = 3), and the statistical analysis was performed using the t-test (*P < 0.05 versus control; **P < 0.05 versus CC/T).Citation34
Abbreviations: CC/T, Tat-admixed conventional cream; EL/T, Tat peptide-admixed elastic liposomes; HST, hirsutenone.
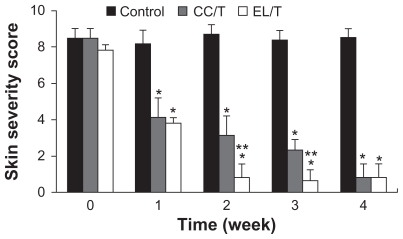
Figure 6 Alterations of (A) iNOS and (B) COX-2 levels in NC/Nga mouse skin after topical application of HST formulations: control, CC/T and EL/T.
Notes: The levels were determined by Western blotting. Bar represents SD (n = 3), and the statistical analysis was performed using the t test (*P < 0.05 versus control;
**P < 0.05 versus CC/T).Citation34
Abbreviations: CC/T, Tat-admixed conventional cream; EL/T, Tat peptide-admixed elastic liposomes; HST, hirsutenone.
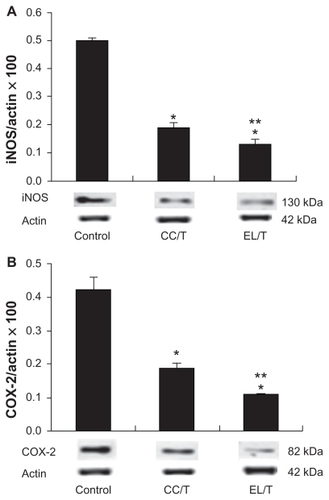
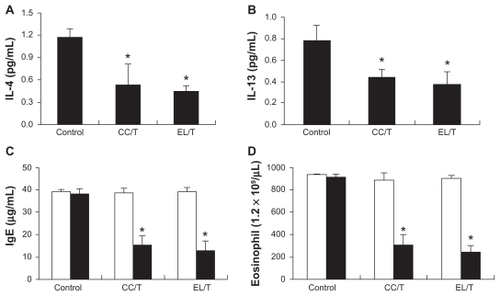
Figure 7 Changes in IL-4, IL-13, IgE and eosinophil levels in NC/Nga mouse blood after topical application of HST formulations: control, CC/T and EL/T. Bar graphs represent the levels before the treatment (empty) and 4 weeks after the treatment (filled). (A) The serum IL-4 levels as measured using an ELISA kit; (B) The serum IL-13 levels as measured using an ELISA kit; (C) the serum IgE levels as measured using an ELISA kit; (D) blood eosinophil number as counted by the microscopic differential count.
Note: Bar represents standard deviation (n = 3), and the statistical analysis was performed using the t test (*P < 0.05 versus control).Citation34
Abbreviations: CC/T, Tat-admixed conventional cream; EL/T, Tat peptide-admixed elastic liposomes; HST, hirsutenone.