Figures & data
Figure 1 PSMA expression on the cell membranes of C4-2, LNCaP, and PC-3 prostate cancer cells Blue fluorescence represents nuclei, and green fluorescence represents PSMA. PSMA protein was highly expressed on the cell surfaces of LNCaP cells and C4-2 cells but was not expressed on the cell surfaces of PC-3 cells.
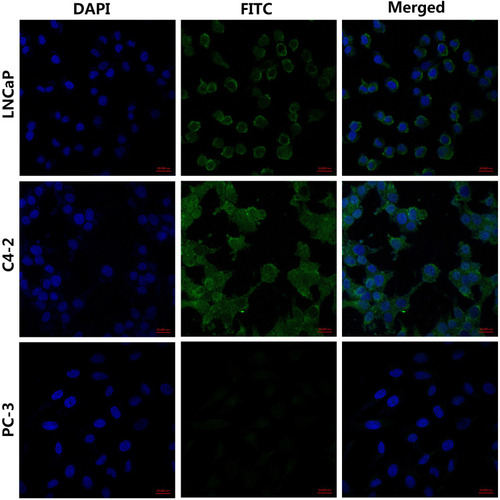
Figure 2 Binding ability of the PSMA-binding peptides to the cells Blue fluorescence represents the nuclei of the three types of prostate cancer cells, and green fluorescence represents the PSMA-binding peptides. The PSMA-binding peptides could specifically bind to PSMA-positive LNCaP cells and C4-2 cells but not to PSMA-negative PC-3 cells.
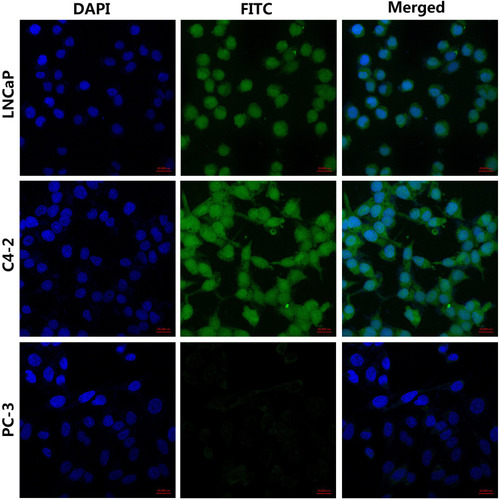
Figure 3 Basic characteristics of the PSMAP/ICG NBs (A) Morphology of the PSMAP/ICG NBs under light microscopy. (B) Morphology of the PSMAP/ICG NBs under transmission electron microscopy. (C) Particle size distribution of the PSMAP/ICG NBs; (D) Histogram showing the time dependence of changes in the concentration and particle diameter of the PSMAP/ICG NBs (* indicates P<0.05). (E) The absorption spectra of free ICG, ICG NBs, and PSMAP/ICG NBs. (F) The toxic effects of PSMAP/ICG NBs at different concentrations on the three types of prostate cancer cells.
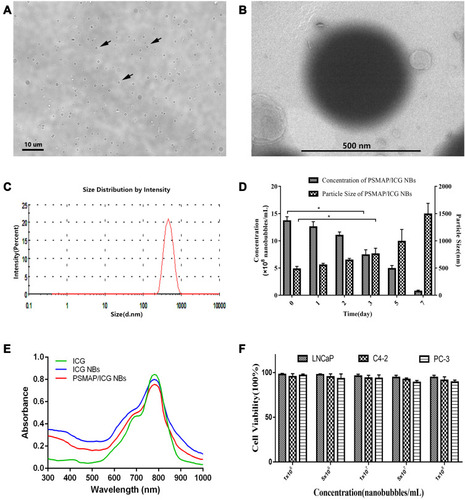
Figure 4 Verification of the coupling of PSMA-binding peptides to the surfaces of the PSMAP/ICG NBs When observed under a confocal laser scanning microscope, the NBs with encapsulated ICG in the lipid shell showed red fluorescence (A), and the FITC-labeled PSMA-binding peptides showed green fluorescence (B). The complete overlap of the two types of fluorescence resulted in yellow fluorescence (C).
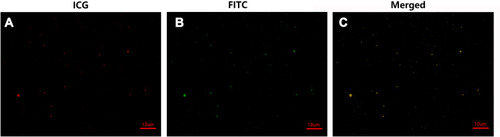
Figure 5 Binding capacity of the PSMAP/ICG NBs and ICG NBs to three types of prostate cancer cells Under CLSM, the nuclei of the three types of prostate cancer cells appeared blue, while the NBs appeared red. Aggregation of PSMAP/ICG NBs was observed around the membranes of LNCaP and C4-2 cells (A, D), while no obvious aggregation of ICG NBs was observed around the membranes of LNCaP and C4-2 cells (B, E). No significant accumulation of PSMAP/ICG NBs or ICG NBs was observed around the membranes of PC-3 cells (G, H). When the cells were blocked with anti-PSMA monoclonal antibody, PSMAP/ICG NBs could not bind to any of the three types of cells (C, F, I).
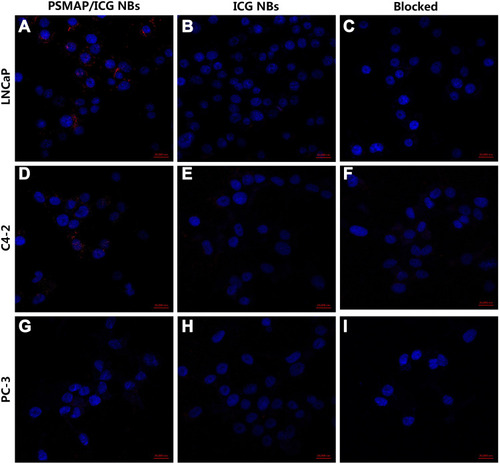
Figure 6 Detection of the affinity of PSMAP/ICG NBs and ICG NBs for cells by flow cytometry (A) LNCaP cells bound a large amount of PSMAP/ICG NBs but not ICG BNs. (B) C4-2 cells bound a large amount of PSMAP/ICG NBs but not ICG BNs. (C) PC-3 cells did not bind to any type of NB. (D) Quantification of the affinities of the two types of NBs for the three types of cells. ** indicates P<0.01.
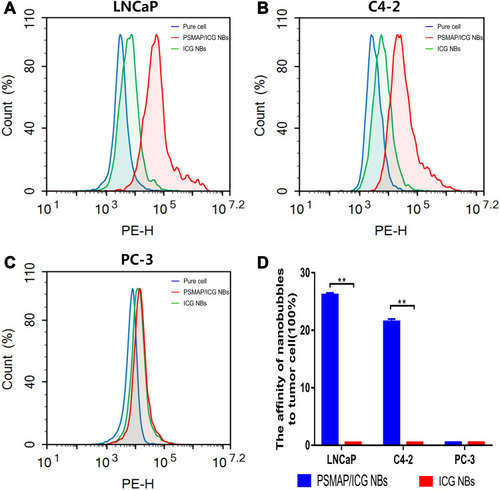
Figure 7 In vitro ultrasound, photoacoustic, and fluorescence imaging of PSMAP/ICG NBs (A) Ultrasound (US) and photoacoustic (PA) imaging of PSMAP/ICG NBs at different concentrations. (B) Quantification of US signal intensities at different PSMAP/ICG NB concentrations. (C) Quantification of PAI signal intensities at different PSMAP/ICG NB concentrations. (D) Fluorescence imaging of PSMAP/ICG NBs and ICG NBs in vitro. (E) Quantification of fluorescence signal intensity of the PSMAP/ICG NBs and ICG NBs in vitro.
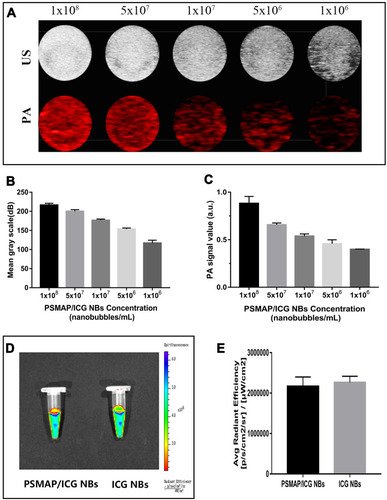
Table 1 Ultrasound Parameters of PSMAP/ICG NBs and ICG NBs in Transplanted Tumors
Figure 8 In vivo ultrasound imaging of PSMAP/ICG NBs and ICG NBs. The red dotted circles represent the area of prostate cancer xenograft tissues. (A) Ultrasound images of PSMA/ICG NBs and ICG NBs in the three types of xenograft tumors. (B–D): The time-intensity curves of ultrasound imaging of each xenograft tumor after injection of PSMA/ICG NBs and ICG NBs. (E) Calculation of the area under the time-intensity curve (AUC) and statistical analysis (n=5). *Indicates P<0.05, **indicates P<0.01.
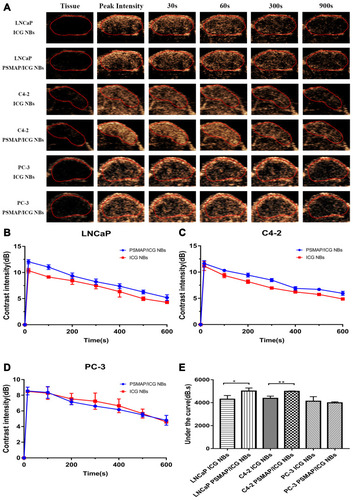
Figure 9 Photoacoustic imaging of the PSMAP/ICG NBs and ICG NBs. (A) Images of PAI of PSMAP/ICG NBs and ICG NBs pre- and post-injection. Inside the yellow dotted circles are the area of the transplanted tumors. The grey signal represents the routine ultrasound signal, and the red signal represents the PA signal. (B) Intensities of PAI of PSMAP/ICG NBs and ICG NBs pre- and post-injection (n=5). **Indicates P<0.01.
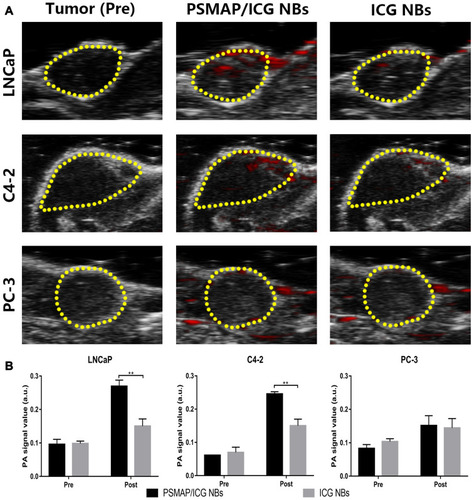
Table 2 Area Under the Time-Fluorescence Intensity Curves of PSMAP/ICG NBs and ICG NBs in Transplanted Tumors
Figure 10 Small-animal live fluorescence imaging of the three types of prostate cancer xenograft tumors in nude mice Near-infrared fluorescence images of nude mice carrying LNCaP, C4-2, and PC-3 xenograft tumors after the injection of PSMAP/ICG NBs or ICG NBs (Inside the red circles are areas of xenograft tumors) (A); Time-fluorescence intensity curves in tumor regions at different time points (B–D).
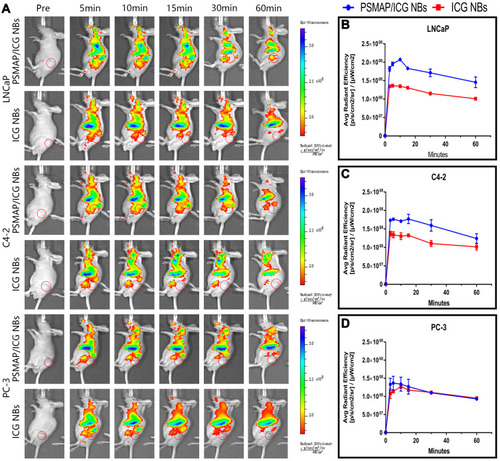
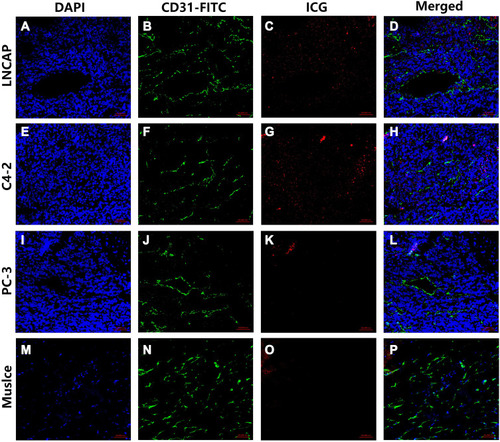
Figure 11 Localization of the PSMAP/ICG NBs in xenograft tumor tissues by immunohistofluorescence. The nuclei of the three types of prostate cancer appeared blue (DAPI), the blood vessels of the tumor appeared green (CD31-FITC), and the PSMAP/ICG NBs appeared red (ICG). A large number of PSMAP/ICG NBs were observed in the intercellular spaces of LNCaP and C4-2 xenografts (A–H). A small number of PSMAP/ICG NBs were observed in the intercellular spaces of PC-3 xenografts (I–L), and PSMAP/ICG NBs were barely visible outside the blood vessels of normal muscle tissues (M–P).
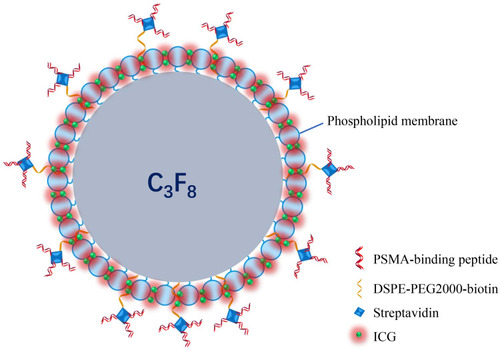
Scheme 1 The schematic illustration of PSMAP/ICG NBs.
Abbreviations: ICG, indocyanine green; C3F8, perfluoropropane.