Figures & data
Table 1 Primer Sequences of Relevant Genes Used for qRT-PCR
Figure 1 Characterization of EGCG-PLGA-NPs (n=9). (A) Particle size distribution based on the images taken. (B) Zeta potential of the particles (C) Scanning electron microscopy (SEM) images of the NPs. Scale bars = 100 nm. (D) Drug loading efficiency and encapsulation efficiency of NPs.
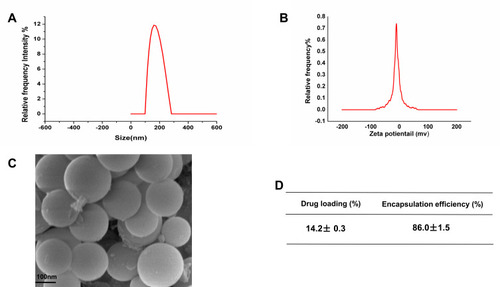
Figure 2 In vitro release and stability of EGCG-NPs. Release profile of (A) from EGCG-NPs (B) stability of EGCG-NPs in PBS at 4°C. The average hydrodynamic diameter (nm) of EGCG-NPs as a function of time (h).
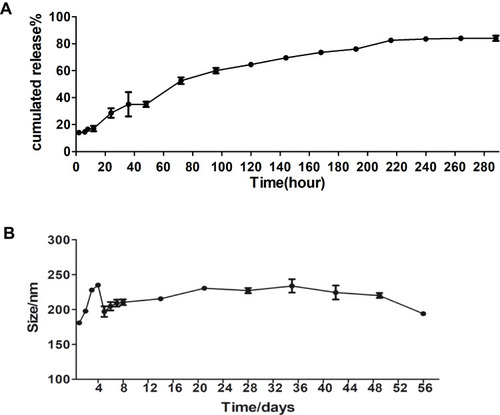
Figure 3 Cellular uptake of the NPs and the effect of EGCG-NPs on lung cancer cell proliferation. Inverted fluorescence microscopy of lung cancer cells harvested 4 h after incubation of NP containing fluorescent-PLGA (red) and counterstained with DAPI for nucleus detection (blue). RGD-NP and non-targeted NP in A549 (A) and H1299 (B). Effects of EGCG-NPs on proliferation of (C, D) A549 cells, (E, F) H1299 cells as determined by CCK8 assay at 72 h and 96 h, respectively. (G) The IC50 on A549 and H1299 cells. Means ± SDs of three independent experiments are shown. *P < 0.05.
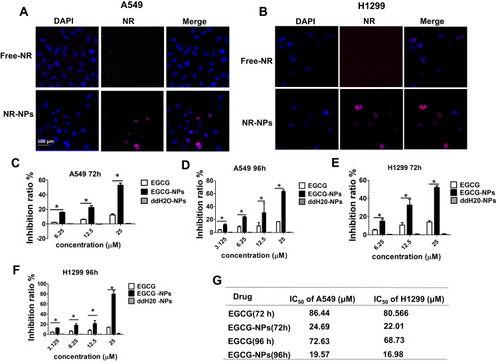
Figure 4 Induction of apoptosis by EGCG-NPs in lung cancer cells. (A, B) Flow cytometry images. (C, D) Quantitative analysis of the percentage of apoptotic cells after 96 h incubation. The percentage of total apoptotic cells was derived from the sum of early and late apoptotic cells. Means ± SDs of three independent experiments are shown. *P < 0.05.
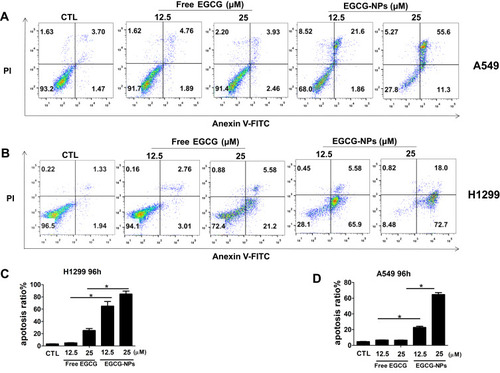
Figure 5 EGCG-NPs induce lung cancer apoptosis via NF-κB inhibition. (A, B) NF-κB specifically binds to the active form of EGCG by BLI kinetic binding assay. Biotin-labeled NF-κB was immobilized onto the Streptavidin Biosensors and tested for kinetic binding to various concentrations of EGCG. The dissociation constant of NF-κB and EGCG is 4.8×10⁻⁵ M. (B) Steady-state analysis, R2=1. (C–F) Western blot analysis of total NF-κB and phosphorylated NF-κB p65 in A549 and H1299 whole-cell lysates after treatment with EGCG and EGCG-NPs (12.5 μM and 25 μM) for 48 h. (G, H) qRT-PCR analysis of C-MYC, Cyclin D1, Bcl-2, Bcl-xL, COX-2, TNF-α, TWIST1, and MMP2 after treatment with EGCG and EGCG-NPs (12.5 μM and 25 μM) for 48 h. Data are shown as the mean ±SDs. (n=3). * P < 0.05.
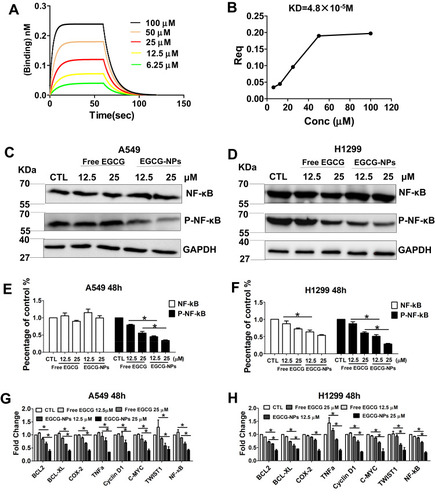
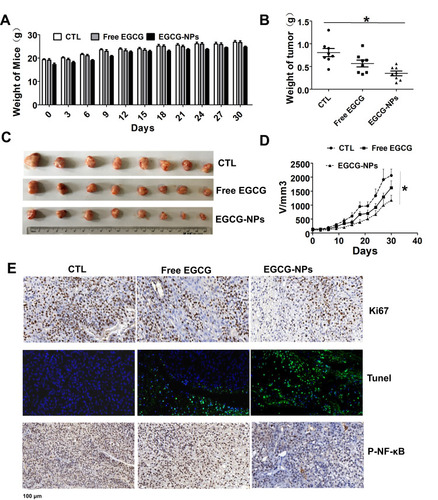
Figure 6 Comparative effects of EGCG-NPs (5 mg/kg) and free EGCG (10 mg/kg) on tumor growth in a PDX model. (A) No significant body weight loss is observed during the treatment period in mice. (B) Treatment with EGCG-NPs resulted in a significant decrease in tumor weight. (C) Representative images of tumors from each group at the termination of the experiment. (D) Graph showing the tumor volumes in each group, assessed using caliper measurements. Data are expressed as the mean ± SDs, n=8. (E) Immunohistochemistry staining (Ki67, TUNEL, and phospho-NF-κB) of tumor tissues. *P < 0.05.